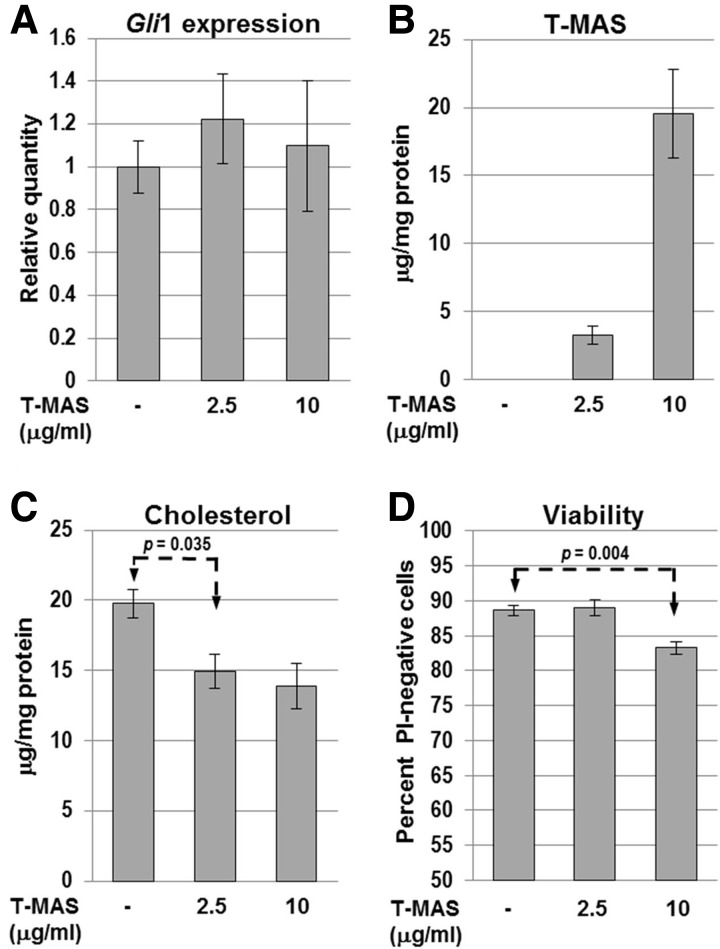
Figure 9.
Effect of exogenous T-MAS on WT (Nsdhlflx5/Y) GCPs in vitro. (A) Relative Gli1 expression levels measured by qPCR in cultured Nsdhlflx5/Y GCPs treated with T-MAS. All samples were cultured with 1 μg/ml SHH. Bars represent the mean ± SEM of 4 independent samples that were each assayed in triplicate with GAPDH as the endogenous control and normalized to the untreated sample set equal to 1. (B) Lysed cell pellet T-MAS concentration and (C) cholesterol concentration determined for aliquots of the cultured Nsdhlflx5/Y GCPs treated with exogenous T-MAS used in panel A. Values indicate the mean ± SEM of 3 independent GCP cultures. (D) Percentage of viable cells in T-MAS-treated cultures, measured by propidium iodide staining, performed as in Figure 7B. The results are the mean ± SEM from 3 independent Nsdhlflx5/Y GCP cultures.

