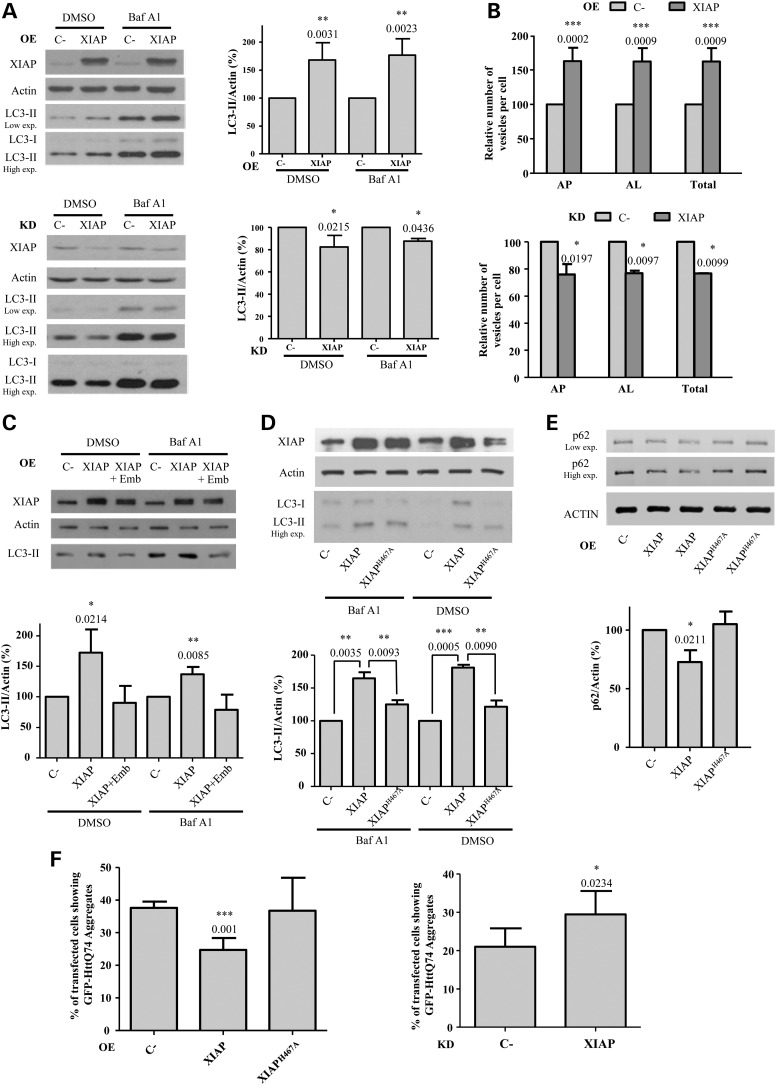
Figure 1.
XIAP induces autophagy. (A) HeLa cells transfected with empty vector (C-) or XIAP expression constructs for 48 h (top panel), or with a control (C-) or XIAP siRNA for 72 h (bottom panel), were treated with DMSO or 400 nm bafilomycin A1 (Baf A1) during the last 4 h. The western blots in both panels are representative of the efficiency of XIAP overexpression (OE) and knockdown (KD) and of the levels of LC3-II in these conditions. (B) HeLa cells stably expressing mRFP-GFP-LC3 transfected with empty vector (C-) or XIAP expression constructs for 48 h (left panel) or with a control (C-) or XIAP siRNA for 72 h (right panel) were fixed and subjected to automatic counting of LC3 vesicles. The histograms in both panels show the percentage relative to C- of the number/cell of autophagosomes (mRFP+/GFP+) (AP), autolysosomes (mRFP+/GFP−) (AL) and both of them (total) (see also Supplementary Material, Fig. S2). (C) HeLa cells previously transfected with empty vector (C-) or XIAP expression constructs for 48 h were treated without or with (for cells transfected with XIAP construct) 20 μM embelin (Emb) during the last 16 h. DMSO or 400 nm bafilomycin A1 (Baf A1) were added during the last 4 h. The western blots in both panels are representative of the efficiency of XIAP overexpression (OE) and of the levels of LC3-II in these conditions. (D) HeLa cells previously transfected with empty vector (C-), wild-type XIAP or XIAPH467A expression constructs for 48 h were treated with DMSO or 400 nm bafilomycin A1 (Baf A1) during the last 4 h. (E) HeLa cells previously transfected with empty vector (C-), wild-type XIAP or XIAPH467A expression constructs for 48 h were subjected to western blotting. (F) HeLa cells were co-transfected with the GFP-HttQ74 expression construct plus empty vector (C-), wild-type XIAP or XIAPH467A expression constructs for 48 h (left panel) or with a control (C-) or XIAP siRNA, where 24 h later the cells were transfected with the GFP-HttQ74 expression construct for 48 h (right panel). In both panels, the cells were then fixed and the percentage of transfected cells with aggregates was calculated as shown in the histograms. At least 150 cells were counted per sample (see also Supplementary Material, Fig. S4). Densitometric measurements of LC3-II or p62 bands were normalized to the corresponding actin bands in the corresponding histograms. The values shown in all the histograms represent the mean ± standard deviation from at least three independent experiments performed in triplicate samples/condition. The P-values were determined using Student's t-test. See also Supplementary Material, Figure S1.

