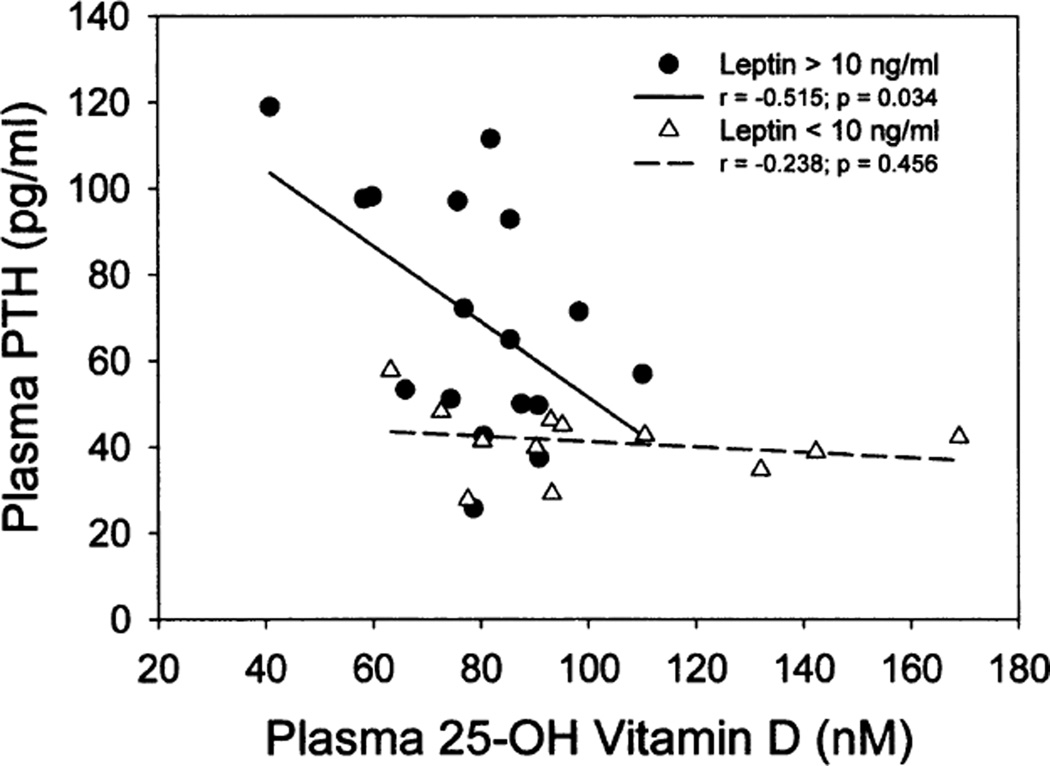
FIG. 2.
Effect of plasma leptin on the observed association between 25-OH-VitD and PTH. Mean values for the 29 subjects were stratified by plasma leptin into those with levels higher or lower than 10 ng/ml and mean PTH concentrations plotted as a function of median plasma 25-OH-VitD for each quintile. Regression lines and correlation coefficients are shown for each subset of data.

