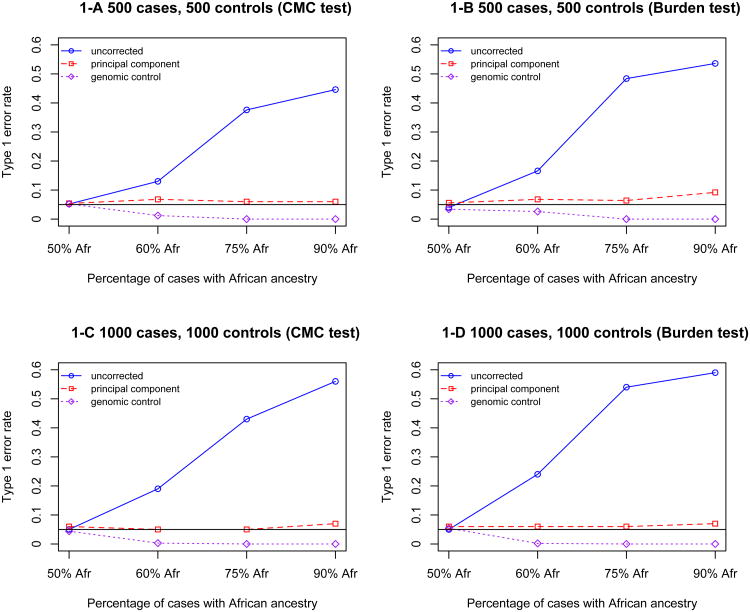
Figure 1.
Type 1 error rate for the CMC and burden tests uncorrected or corrected by principal component and genomic control for a 10kb region. 1-A: 500 cases and 500 controls collapsed by the CMC method; 1-B: 500 cases and 500 controls collapsed by the burden test; 1-C: 1000 case and 1000 control collapsed by the CMC method; 1-D: 1000 cases and 1000 controls collapsed by the burden test. Note that in all simulations, 50% of controls have African ancestry and 50% have European ancestry, while the proportion of cases with African ancestry varies across simulations (X-axis).

