
Figure 5.
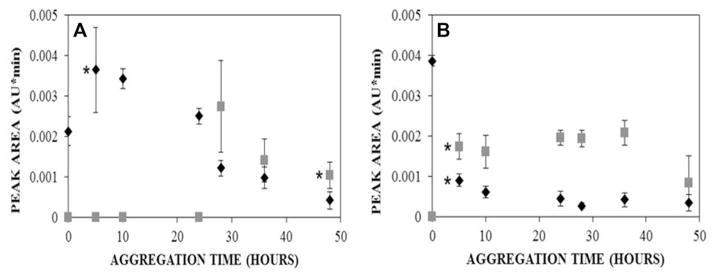
Effect of aggregation time on the peak areas obtained for the initially present 10–30 kDa species (◆, n = 3) and >300 kDa oligomer (
 , n = 3) for freshly dissolved Aβ1–40 (A) and SEC-purified Aβ1–40 (B). Peak area was determined using a Gaussian fit. (A) * represents the first time point in which peak areas are statistically different from the 0 h peak area with p < 0.05.