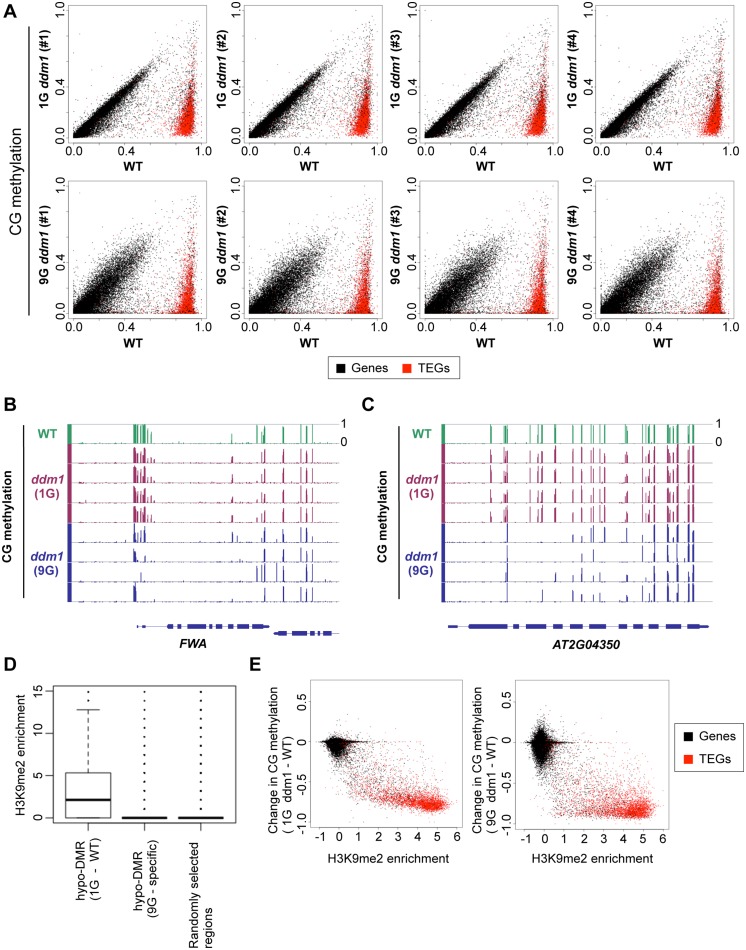
Fig 2. Change of CG methylation during self-pollination of ddm1 mutants.
(A) CG methylation level compared for each transcription unit. Each dot represents the DNA methylation level in a gene (black dot) or a transposable element gene (TEG, red dot). The top half shows effects in four different 1G ddm1 plants, while the bottom half shows effects in four different 9G ddm1 plants. Each of the 9G plants was originated from independent self-pollinations. Comparison of the 9G ddm1 plants to independently self-pollinated 9G DDM1 plants (S1 Fig) is shown in S3 Fig. “WT” is a DDM1/DDM1 plant segregating as a sibling of the 1G ddm1/ddm1 plants. (B, C) Genome browser views of loci with CG methylation reduced in 9G ddm1 using the Integrated Genome Browser [74]. FWA locus (B) and AT2G04350 locus (C) are shown. The FWA gene has dense CG methylation around the 5’ end, which is lost during self-pollination of the ddm1 mutant. (D) H3K9me2 level of differently hypo-methylated regions (hypo-DMRs) in CG context. Left (1G - WT): Distribution of 119,883 DMRs between WT and 1G ddm1 mutant. Center (9G - specific): Distribution of 25,861 DMRs between WT and 9G ddm1, excluding DMRs between WT and 1G ddm1. Distribution of 100,000 randomly chosen 100 bp regions is also shown as a control (right). H3K9me2 level of wild type is shown by reads per million (RPM) in ChIP-seq data obtained from GEO (GSE28398 [72]). (E) Change in CG methylation level in 1G ddm1 (left) and 9G ddm1 (right) from wild type, plotted against enrichment of H3K9me2 in wild type (data from Inagaki et al. 2010).

