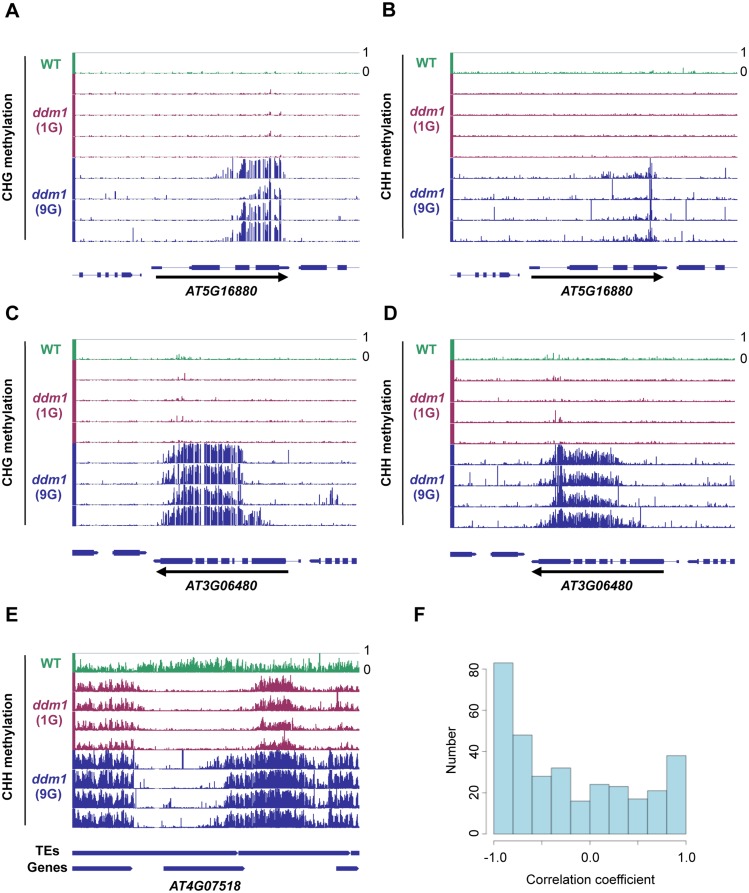
Fig 5. Spread of non-CG methylation in self-pollinated ddm1 mutants.
(A-E) Genome browser views of loci with non-CG methylation in the 9G ddm1 plants. AT5G16880 (A-B), AT3G06480 (C-D), and AT4G07518 loci (E) are shown for CHG (A, C) and CHH (B, D, E) contexts. Direction of transcription is shown by an arrow in A-D. (F) Histogram of correlation coefficient between the CHG methylation level and the relative centroid position of CHG methylation within the DMR. The centroid position was determined by averaging relative position of the methylated cytosine weighed with the methylation level for each residue. The coefficient was calculated among the four 9G ddm1 plants in each conDMR for CHG methylation between 9G and 1G ddm1 (details in Materials and Methods section) overlapping with genes. The coefficient becomes negative when the centroid moves to the 5’ regions as the average level of CHG methylation in the conDMR increase. A large proportion of the contiguous DMRs with the coefficient near -1 reflects spread of CHG methylation from 3’ to 5’ regions as the CHG methylation levels increase.

