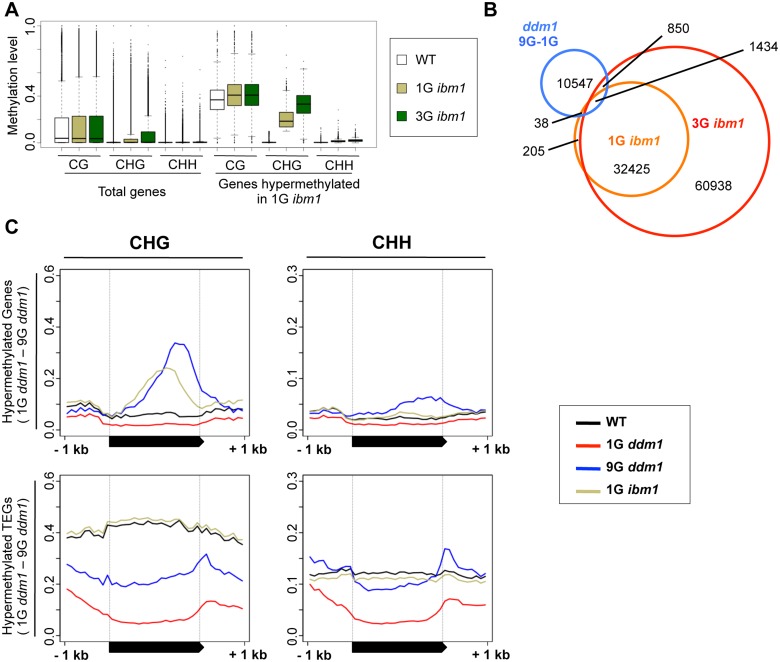
Fig 6. Hypermethylated regions in ddm1 and ibm1 mutants.
(A) Increase of CHG methylation in 1G and 3G ibm1 mutants. Genes hypermethylated in 1G ibm1 (CHG methylation level < 0.1 in WT and ≥ 0.1 in 1G ibm1) are shown (right) with total genes (left). Profiles for multiple 1G and 3G ibm1 mutant plants are shown in S15 Fig. (B) Comparison of regions CHG hypermethylated in ibm1 and 9G ddm1. DMRs between 9G and 1G ddm1 (blue), between 1G ibm1 and WT (orange), and between 3G ibm1 and WT (red) are shown. Heat map of CHG methylation for these DMRs are shown in S16B Fig. (C) DNA methylation profile for the genes CHG hyper-methylated in 9G ddm1 (shown in Fig 3D). The top and bottom half represent genes and TEGs, respectively. In these regions, CHH methylation also increased in 9G ddm1.

