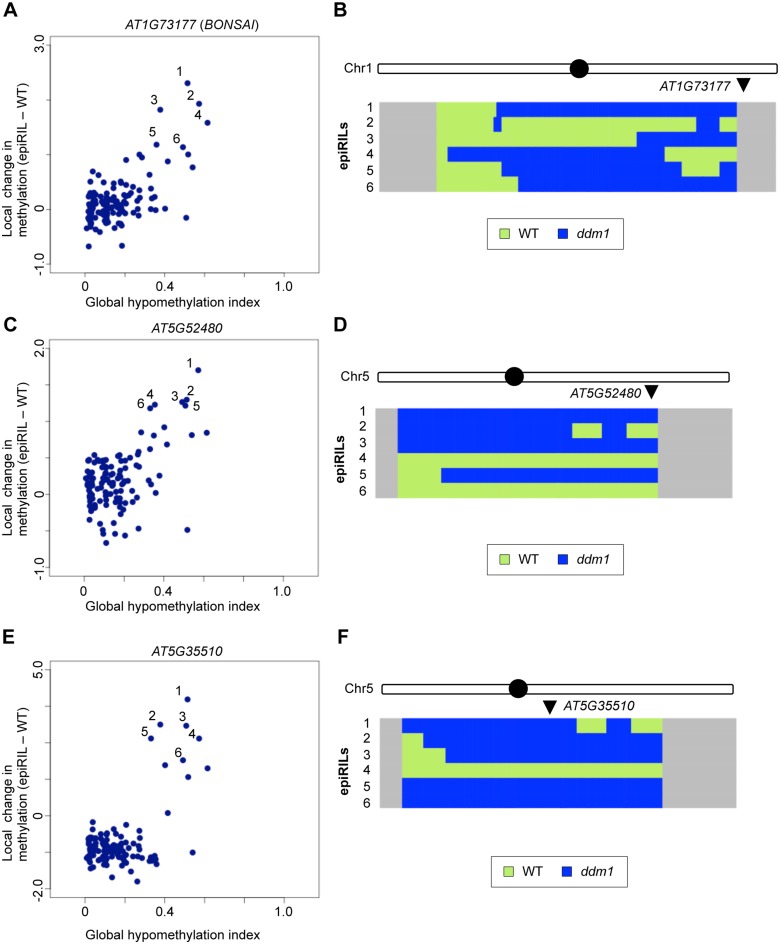
Fig 7. Effects of disrupted heterochromatin in the DDM1 wild type background examined by IP.
(A, C, E) Changes in local DNA methylation plotted against the global level of DNA hypomethylation in 123 epigenetic recombinant inbred lines (epiRILs). Each dot represents the value for one line. Three loci, AT1G73177 (BONSAI) (A), AT5G52480 (C), and AT5G35510 (E) are shown. Results with four other loci are shown in S17 Fig, with values for the F0 ddm1 and WT parents. (B, D, F) WT (light green) / ddm1 (dark blue) haplotype for epiRILs that showed increase of cytosine methylation for each locus (numbered 1–6 for each locus, the line names can be different among the panels). In each panel, the chromosome including the target locus (arrowhead) is shown. Haplotypes of all five chromosomes are shown in S18–S23 Figs. The filled circles indicate centromere positions. The haplotypes are predicted from stably hypomethylated markers [46]. The regions not covered by any markers are indicated in gray. Names of epiRILs numbered 1–6 in each panel are in Materials and Methods. Data of epiRILs were obtained from GEO (GSE37284 [46]).

