
FIG. 1.
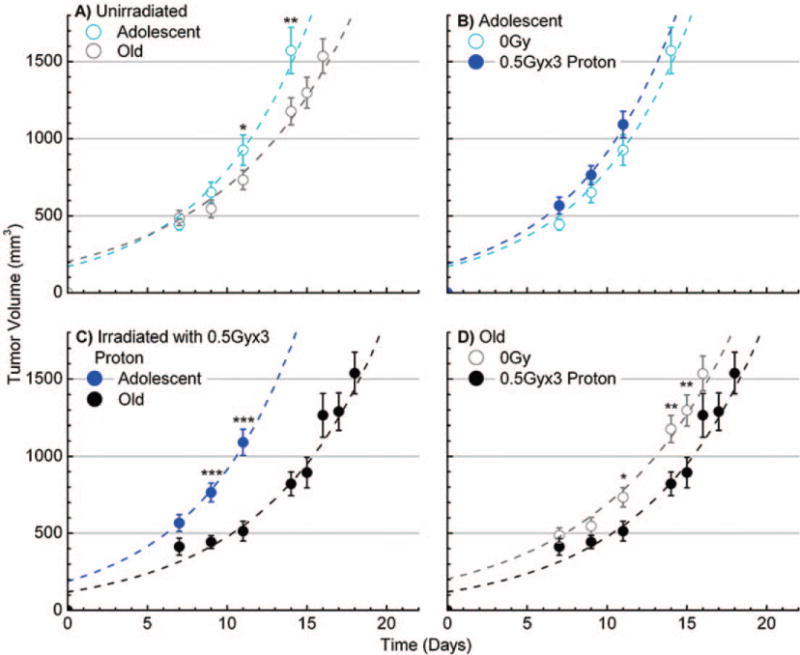
Tumor growth in adolescent and old mice, with or without proton irradiation. Panels A–D: The data showed average measured tumor volumes, after injection at time 0, of murine Lewis lung carcinoma (LLC) in C57BL/6 mice with and without 3 × 0.5 Gy of proton irradiation (1 GeV). All 0 Gy conditions have n = 20 mice and all proton-irradiated conditions have n = 10 mice. Panels A and C: Compare data from adolescent vs. old mice without and with irradiation, respectively. Panel B: Depicts data for proton-irradiated adolescent vs. nonirradiated and panel D: proton-irradiated old vs. nonirradiated mice groups. The time post-cell-injection is shown on the x axis. Error bars show ±SE and asterisks indicate time points where there is a statistically significant differential even when ignoring information from the other time points; *P < 0.05, **P < 0.01 and ***P < 0.001. The dashed lines indicate a generated best fits in terms of two quantities, tumor growth rates after approximately exponential growth starts and “effective” initial tumor volumes as explained in the Materials and Methods section.