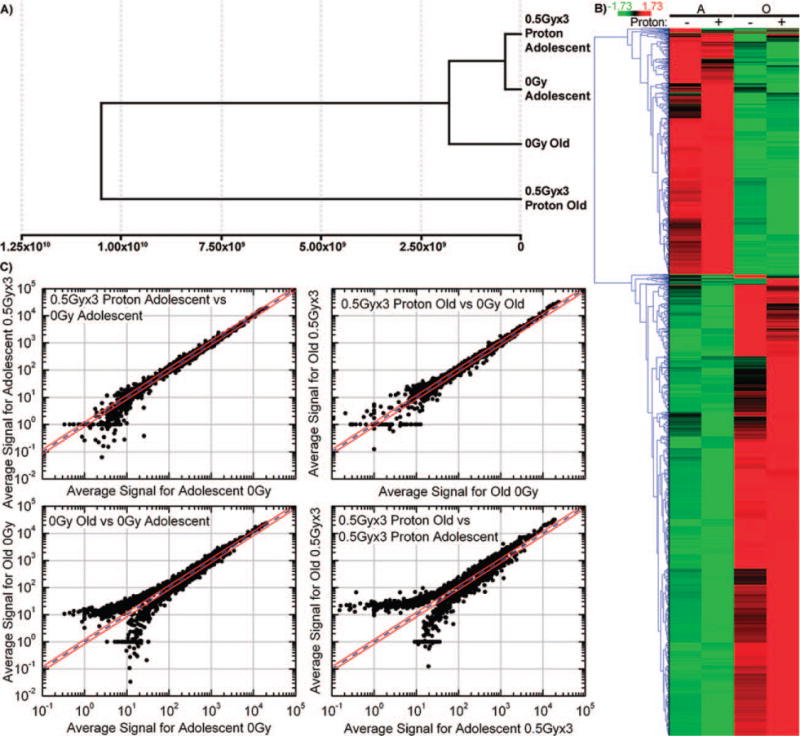
FIG. 2.

Gene regulation changes for tumors as a function of host age and proton irradiation status. Panel A: Cluster analysis of expression data, done by Euclidean distance calculation displayed as a dendrogram, for LLC tumors growing in adolescent and old mice, with or without 3 × 0.5 Gy whole-body proton irradiation. Data expression patterns from tumors in the irradiated and nonirradiated adolescent groups cluster together, with that for tumors in nonirradiated old mice being similar. The overall expression pattern of tumors growing in the old mice is observed to be considerably perturbed by exposure to protons. Panel B: Hierarchical clustering of genes by average linkage (UPGMA) and Euclidean distance calculation between age groups adolescent (A) and old (O) and irradiation groups (− for 0 Gy and + for 3 × 0.5 Gy proton). Panel C: Logarithmic scatter plots comparing gene expression in: adolescent mice (0 Gy) vs. adolescent mice (3 × 0.5 Gy proton); old mice (0 Gy) vs. old mice (3 × 0.5 Gy proton); adolescent mice (0 Gy) vs. old mice (0 Gy); and adolescent mice (3 × 0.5 Gy proton) vs. old mice (3 × 0.5 Gy proton). The blue line is referred to as the identity line, while the two outer red lines represent the window of genes that are up- or down-regulated 1.2-fold from the identity line. Points that fall outside the 1.2-fold window represent genes that were found to be more than 1.2-fold up- or down-regulated between the samples compared.
