
FIG. 3.
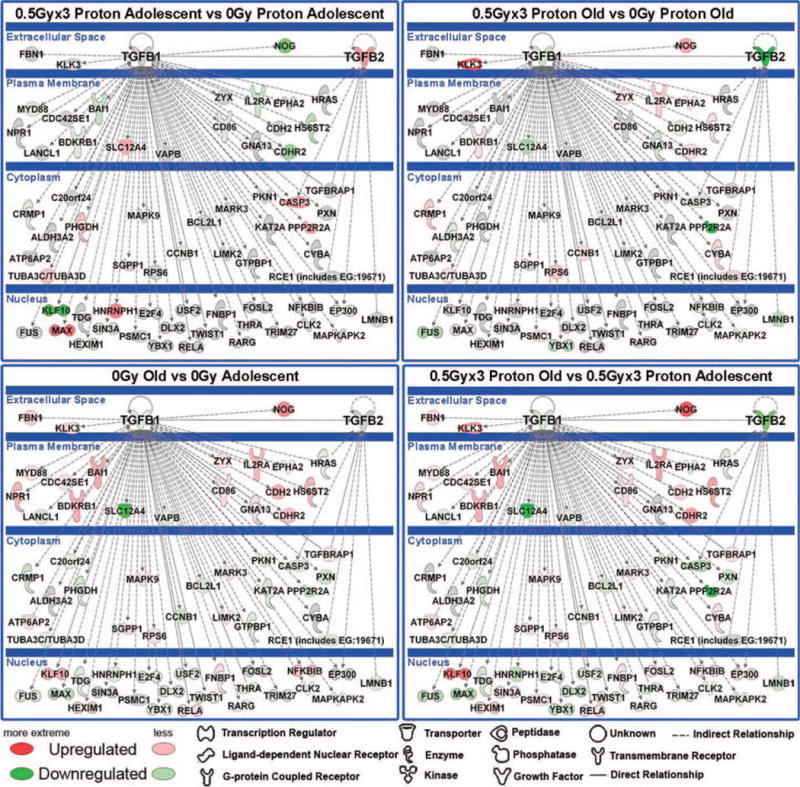
Gene network analysis for key genes involved in age-dependent tumor progression as a function of proton irradiation. Pathway analysis was done with Ingenuity Pathway Analysis (IPA) software. The network depicted contains central nodes from TGFβ1 and TGFβ2 with direct (solid lines) and indirect (dashed lines) relationships to these molecules. Log2-fold changes to the gene expression were used to obtain different shades of green for regulation levels for 1.2-fold change in down-regulated genes, while different shades of red depict regulation levels for 1.2-fold change in up-regulated genes. Grey depicts genes that exist in the network without a significant 1.2-fold change under the perturbation investigated. The darker the shade of green or red, the greater the fold change.