
FIG. 1.
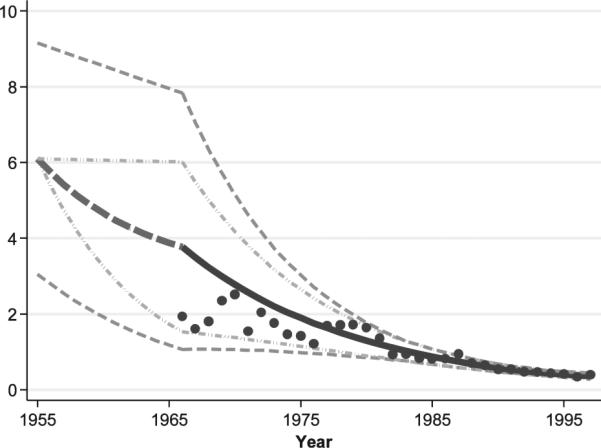
Temporal variation in annual estimates of the population GM badge doses for civilian full-time hospital workers incorporating within-year limiting values for the period from 1955–1997. Work-pattern adjusted annual badge dose GM estimates are based on data from workers with badge dose readings from 1966 onwards, indicated by the black dots. The light gray dash-dot curves represent the upper and lower badge dose GM limits developed from the badge dose data. The dark gray dashed curves represent the upper and lower limits for badge dose GMs after allowing for realization-specific random bias factors. The solid back line represents the expected badge dose GM values.