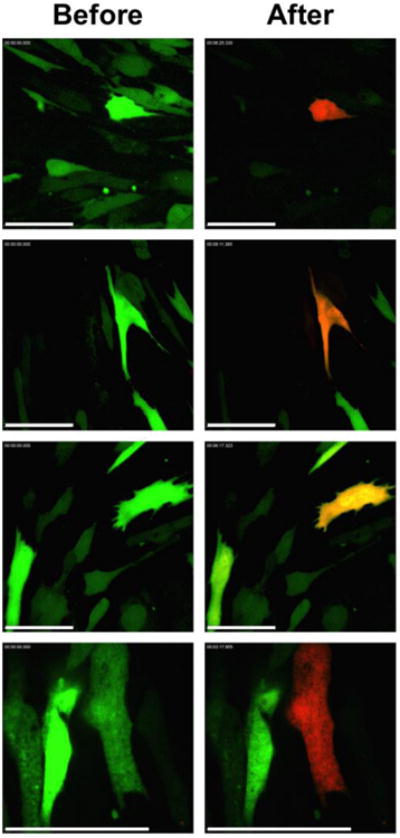
Figure 3. Photo-conversion of single cells.

Individual hWJCs were targeted for photo-conversion. The left column displays the fluorescence of cells before photo-conversion. The right column displays cells after photo-conversion. The amount of Dendra2 produced in each cell varied, thus some targeted cells displayed a strong expression of red fluorescence while other cells display a weak expression of red fluorescence after photo-conversion. The images displayed are a random collection of images taken from three different (n = 3) different populations of hWJCs transfected with Dendra2. Scale Bar = 100 μm.
