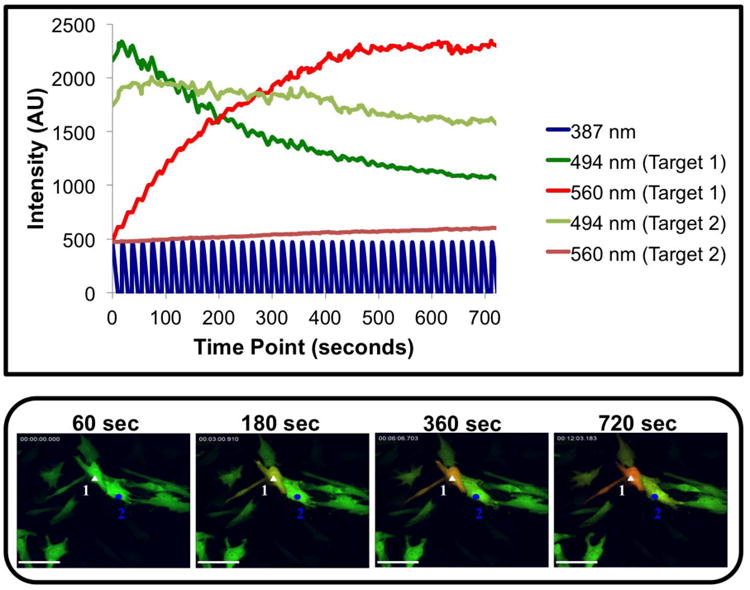
Fig. 4. Kinetics of targeted and non-targeted cells for photo-conversion.

The UV light beam was confined to a 15 – 20 μm diameter to restrict UV light exposure to a selection of one to two hWJCs. Changes in fluorescent intensity for both green and red fluorescence were measured in two adjacent cells over the course of 720 s. The cell designated “Target 1” is labeled with a white triangle and was exposed directly to the UV light beam, whereas the cell designated “Target 2” is labeled with a blue circle. Target 1 was exposed to UV light at 20 mW every 20 seconds at a frequency of 1 Hz. Over the course of 720 s, the green fluorescence rapidly decreased while the red fluorescence steadily increased in Target 1. Green fluorescence decreased slightly, and red fluorescence increased slightly in Target 2, but photo conversion did not occur within the measured time period, demonstrating that select cells can be targeted in culture. Please refer to Supplementary Figure 2 to view the full time-lapse video a single recording representative of all attempts to demonstrate isolated photo-conversion. The results displayed were fully consistent with nine attempts to photo-convert individual cells from three different umbilical cords. AU = Arbitrary Unit; Scale Bar = 100 μm.
