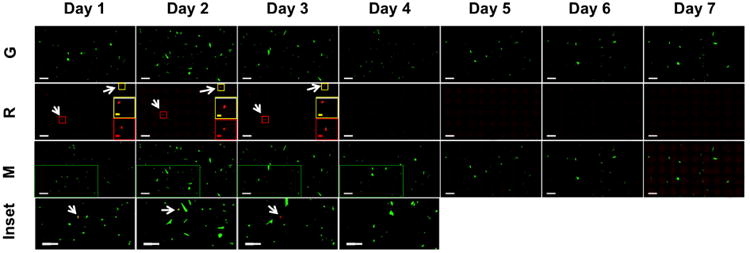
Fig. 7. Tracking the expression of Dendra2 over 7 d.

Select hWJCs were photo-converted with UV light at an intensity of 100 mW for 10 s at a frequency of 1 Hz within a population of positively transfected cells. Green fluorescence was monitored for 10 d; however, green fluorescence and red fluorescence were not detectable beyond 7 d after transfection. Images are composite image montages composed of 45 neighboring fields of view stitched together into a 5 × 9 image. The top row of images shows only the green fluorescence channel. The second row down shows only the red fluorescence channel. A red inset box and yellow inset box display an enlarged image of the photo-converted hWJC. The third row down displays composite images where the green fluorescent and red fluorescent channels have been merged. Green inset boxes are displayed in images corresponding to days 1 – 4, and are enlarged in the fourth row down. White arrows indicate the location of hWJCs that were photo-converted and express red fluorescence. No red fluorescence was detected in days 4 – 7 from cells that were photo-converted 1 d after transfection. The experiment was run twice with cells from three different umbilical cords (n = 3). The images are representative of all samples run. G = Green fluorescence channel. R = Red fluorescence channel. M = Merged green and red fluorescence channel. Inset corresponds to the green inset box in the “M” row. White Scale Bar = 400 μm. Yellow Scale Bar = 200 μm. Red Scale Bar = 200 μm.
