
Figure 6. Bursts and pauses of SNpr neurons in awake, head-restrained mice.
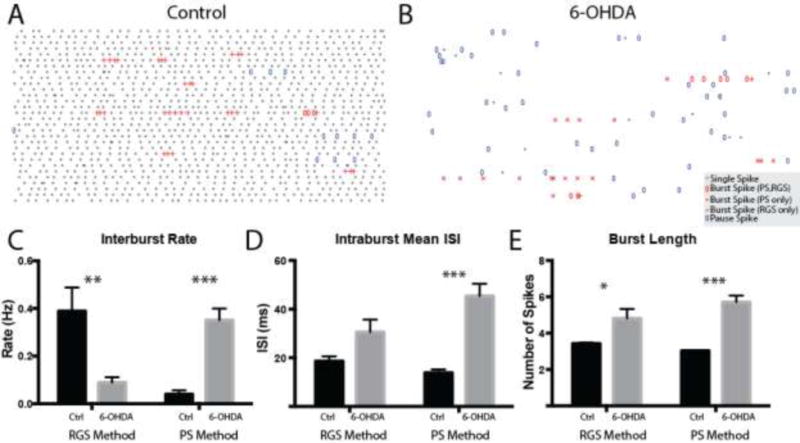
Representative raster plots (1 s per row) of control and 6-OHDA SNpr neurons are shown in A and B, respectively. Single spikes are colored gray. Burst spikes detected by both the PS and RGS methods are depicted with open red ovals. Burst spikes detected by the PS method but not the RGS method are depicted with red crosses. Burst spikes detected by the RGS method but not the PS method are depicted with red pluses. C–F Summary data for the interburst rate (C, RGS: control: 1.06 ± 0.103 Hz, 6-OHDA: 0.862 ± 0.080 Hz, p = 0.135 UTT; PS: control: 0.607 ± 0.079, 6-OHDA: 0.804 ± 0.110, p = 0.158 UTT), mean intraburst ISI (D, RGS: control: 7.19 ± 0.417 ms, 6-OHDA: 7.69 ± 0.360 ms, p = 0.260 MWU; PS: control: 6.90 ± 0.295, 6-OHDA: 8.75 ± 0.550, p = 0.008 MWU), pause rate (E, control: 0.708 ± 0.063 Hz, 6-OHDA: 1.00 ± 0.125 Hz, p = 0.041 UTT) and mean intrapause ISI (F, control: 42.8 ± 1.99 ms, 6-OHDA: 55.4 ± 5.33 ms, p = 0.243 MWU) are shown.*, p < 0.05; **, p < 0.01.