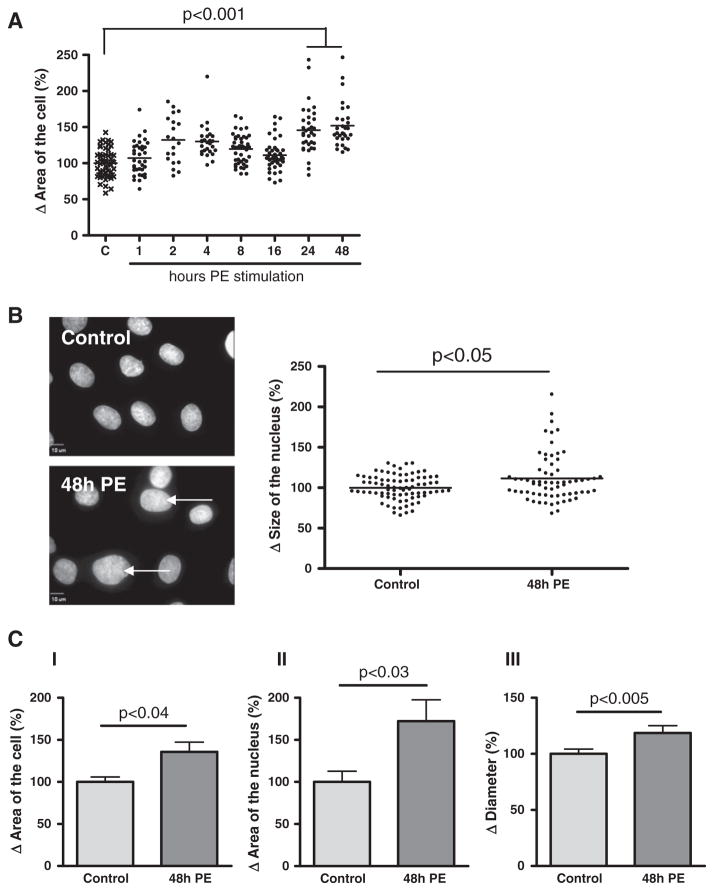
Fig. 1.
Phenylephrine induced hypertrophy of H9c2 cells. Digital-imaging microscopy analysis of phenylephrine (PE)-stimulated H9c2 cells after different time intervals. Analysis of (A) area of the cell (n = 6) and (B) size of the nucleus (n = 4) of attached H9c2 cells. Images of nuclei are stained with DAPI (blue signal), representative for n = 4. Arrows indicate increased area of the nucleus. (C) Analysis of phenylephrine (PE)-stimulated H9c2 cells after 48 h. Electron microscopy analysis of (I) area of the cell (n = 5), (II) area of the nucleus (n = 5) and Automated Cell Counter analysis of (III) diameter (n = 3) of H9c2 cells in suspension. The changes are shown as the difference (Δ) in the percentage compared to control cells set to 100%.

