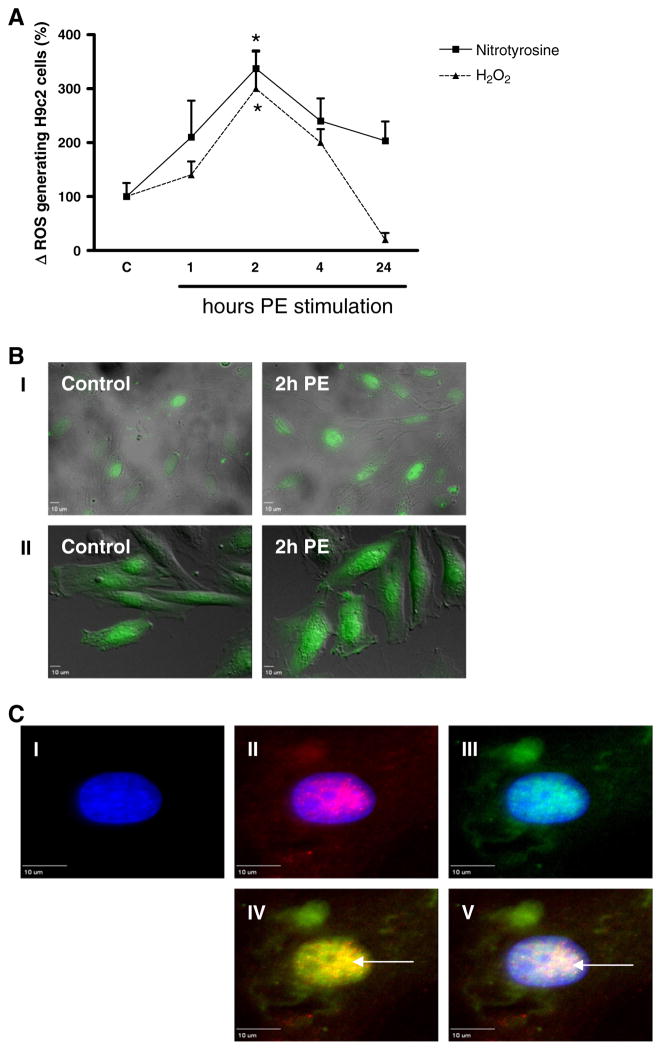
Fig. 3.
Time-dependent subcellular phenylephrine-induced ROS generation in H9c2 cells. Digital-imaging microscopy analysis of phenylephrine (PE)-stimulated H9c2 cells after different time intervals. (A) Cellular ROS levels as measured via nitrotyrosine and H2O2 (CM-H2DCFDA) (n = 3). Changes are shown as the difference (Δ) in the percentage compared to control cells set to 100%. *p < 0.01. (B) Subcellular localization analysis of nitrotyrosine (I, green signal) and H2O2 (II, green signal), representative for n = 3. (C) Subcellular localization of NOX2 and nitrotyrosine in phenylephrine-stimulated H9c2 cells. Cells were stained with DAPI (nuclei; I blue signal) and for NOX2 (II, red signal) or nitrotyrosine (III, green signal). Pictures IV and V demonstrate that after 2 h of PE (peri)nuclear NOX2 focally coincides with nitrotyrosine (yellow signal, arrow) and with DAPI (white signal, arrow).

