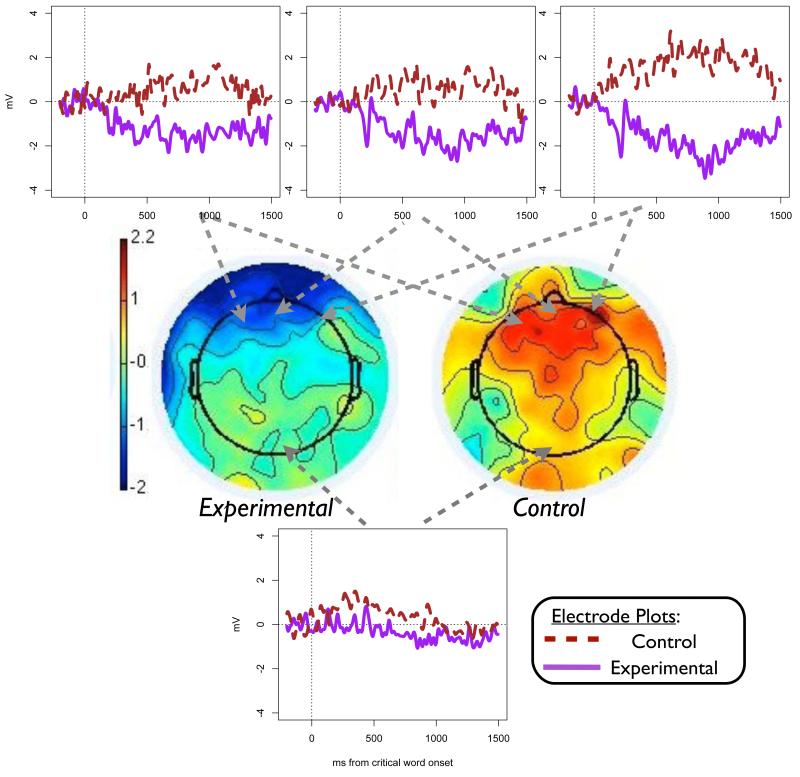
Figure 2.
Difference waves (declarative – conditional) at the rest in Experiment 1. Topographical plots are shown at 600 ms post-stimulus. Four representative electrodes are depicted for the entire epoch. The relative negativity for the difference waves in the experimental sentences is driven by a positive deflection for the conditional sentences (see main text).

