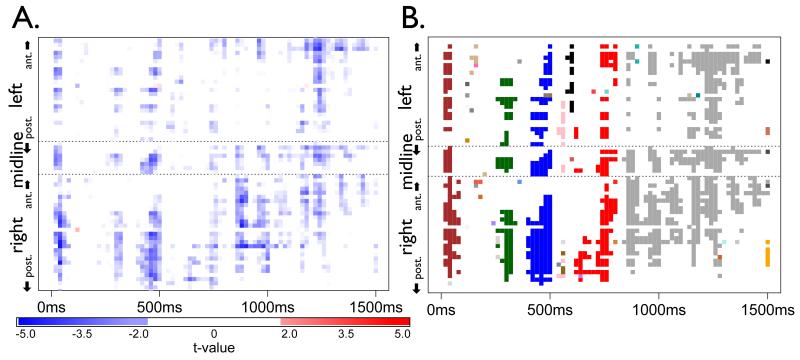
Figure 4.
Permutation cluster analyses at the rest in Experiment 2. In each panel, electrodes are grouped into left-hemisphere, midline, and right-hemisphere, with more anterior electrodes placed higher. Panel A: t-values. Panel B: clusters (distinct color for each cluster). The significant cluster is in grey.

