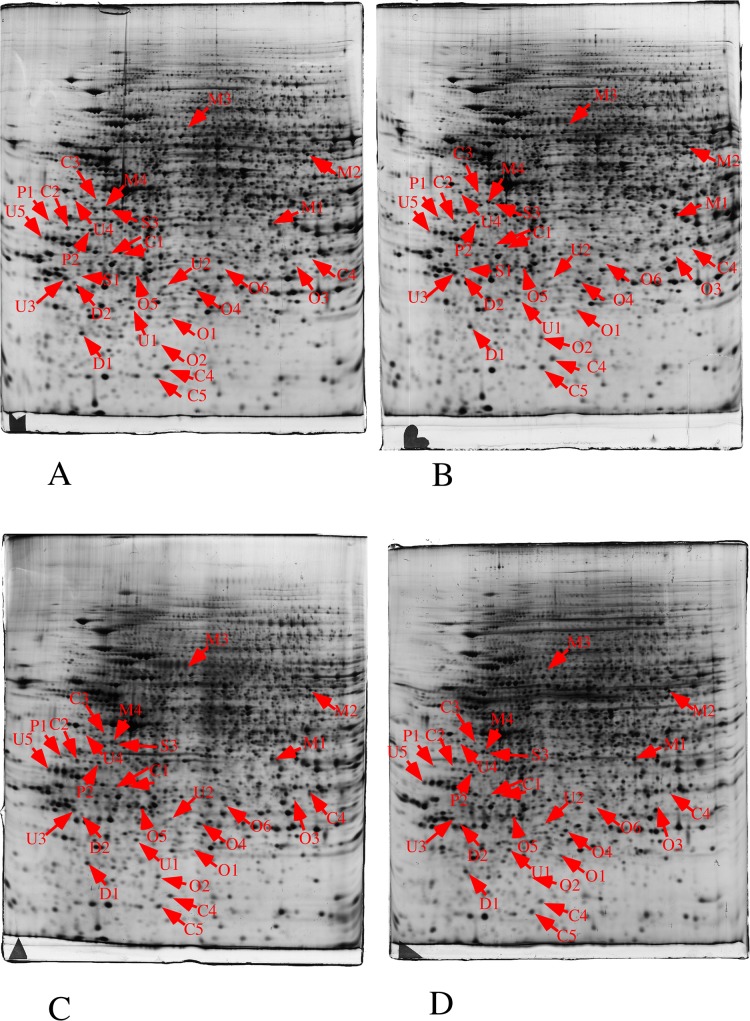
Fig 3. Proteomic analysis of total cell extracts by 2D electrophoresis.
Total cell extracts of J774 cells were separated by two-dimensional gel electrophoresis. The first dimensions covered a 4–8 pH range and the second dimension a 15–200 kDa range. Total cellular proteins (150 μg) were loaded on the first dimension gel. A: gel obtained from control cells. B: gel obtained from cells treated with titanium oxide (100μg/ml, 24 hours). C: gel obtained from cells treated with copper oxide (10μg/ml, 24 hours). D: gel obtained from cells treated with copper oxide (125μM, 24 hours). The arrows point to spots that show reproducible and statistically significant changes between the control and NP-treated cells (p≤ 0.05). Spot numbering according to Table 3.

