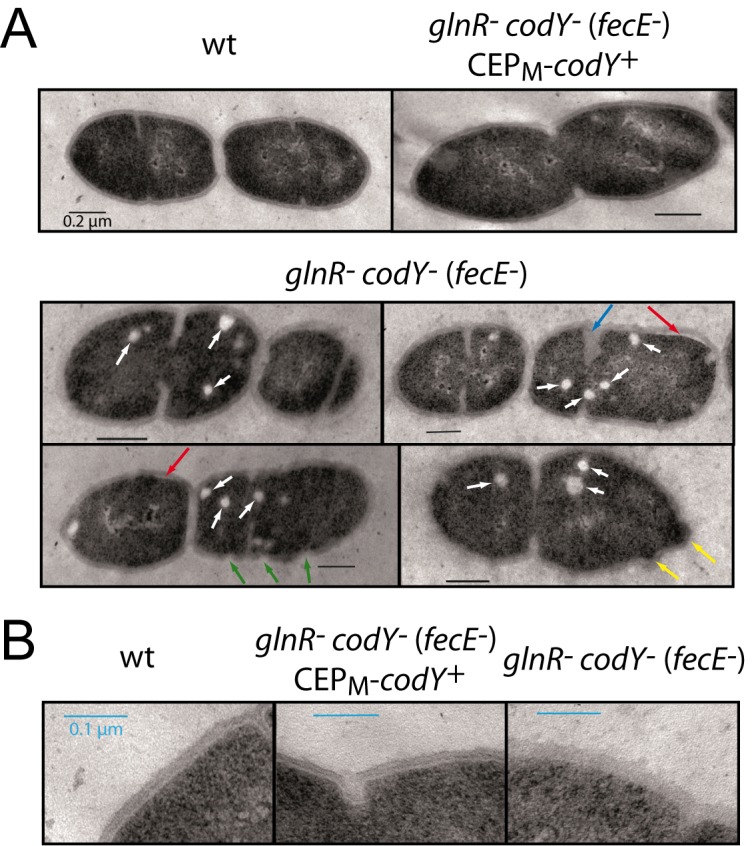
Fig 6. Altered cell morphology of the glnR codY (fecE) mutant visualized by TEM.

(A) Visualization of wt, glnR - codY - (fecE -) CEPM -codY + and glnR - codY - (fecE -) cells by TEM. Strains used, wt, D39; glnR - codY - (fecE -) CEPM -codY +, TD273; glnR - codY - (fecE -), TK108. Red arrows, detached cell wall; green arrows, gaps in cell wall; white arrows, circular clear bodies present within cells; blue arrow, aberrant septum formation. Black scale bars represent 0.2 μm. (B) Visualization of zoomed images of the strains in panel A focusing on cell wall. Blue scale bars represent 0.1 μm.
