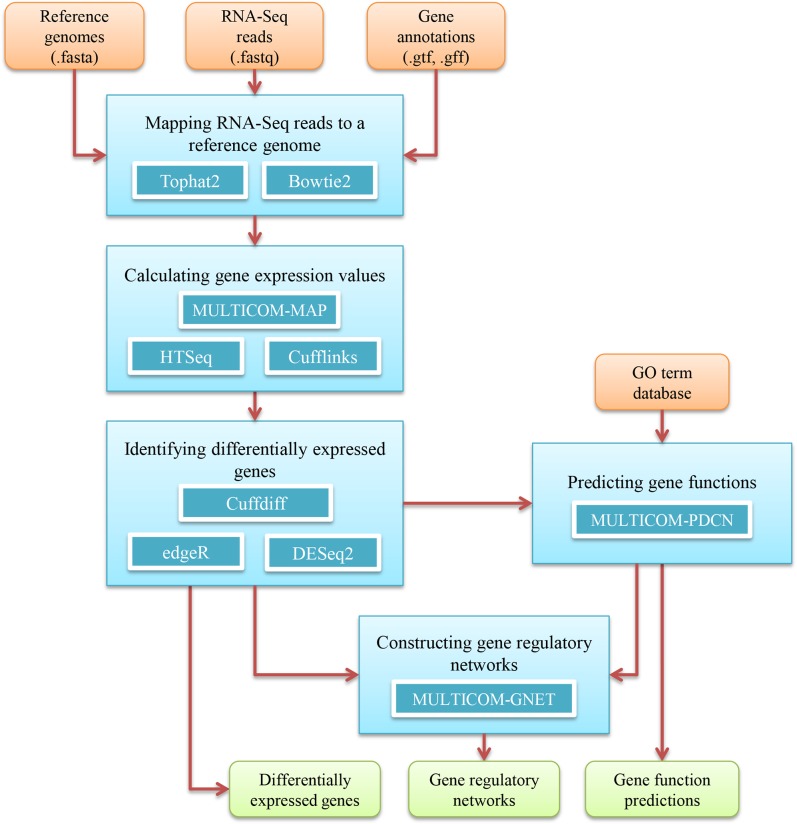
Fig 1. The RNAMiner protocol for big transcriptomics data analysis.
Five blue boxes denote five data analysis steps, i.e. mapping RNA-Seq reads to a reference genome, calculating gene expression values, identifying differentially expressed genes, predicting gene functions, and constructing gene regulatory networks. The tools used in each step are listed inside each box. The external input information is represented by brown boxes and the final output information is represented by green boxes. The information flow between these components is denoted by arrows.

