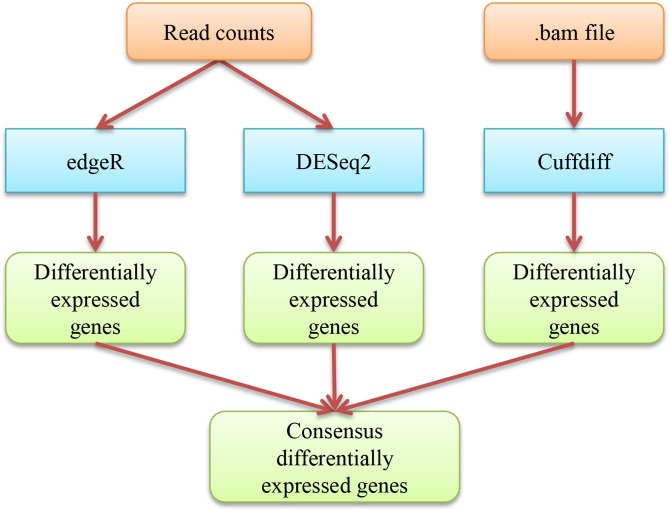
Fig 3. The workflow of identifying differentially expressed genes.
The blue boxes denote the tools (edgeR, DESeq2, Cuffdiff) used in the step of identifying differentially expressed genes. The external input information is represented by brown boxes and the output information is represented by green boxes. The information flow between these components is denoted by arrows.

