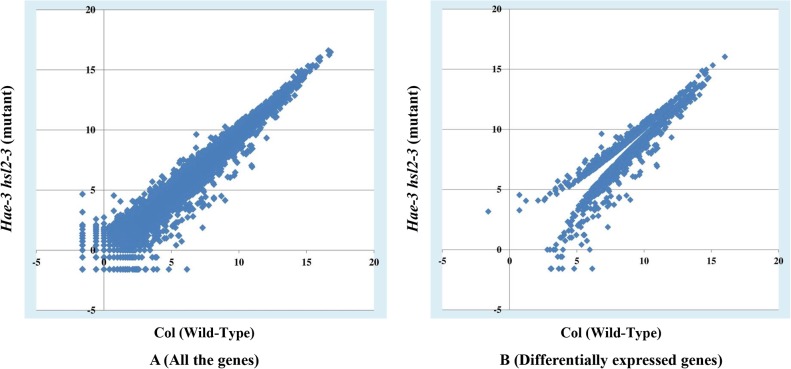
Fig 9. Two gene expression plots in the fifth data set.
These plots are for the comparison between Col and hae-3 hsl2-3. The x-axis represents Col (Wild-Type) and the y-axis represents hae-3 hsl2-3 (mutant). The left plot visualizes the expression values of all the genes, and the right one displays the expression values of differentially expressed genes. The gene expression values were calculated by MULTICOM-MAP. The raw counts were transformed by log2.

