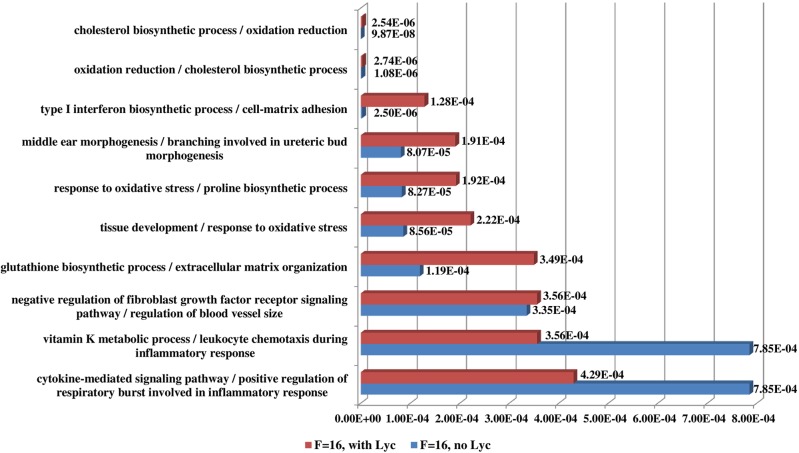
Fig 15. Top 10 biological process functions in the second data set.
These functions were predicted for two comparisons between 2A (Control, no FruHis, no Lycopene) and 2F (FruHis = 16 without Lycopene), between 2A and 3D (FruHis = 16 with Lycopene). Red bars denote the p-values of the top 10 predicted functions for the comparison between 2A and 3D and blue bars denote the p-values of the top 10 predicted functions for the comparison between 2A and 2F. The number besides each bar is the significance of enrichment (p-value) of the predicted function. The p-value was calculated by Fisher’s exact test. The function names of the two comparisons between 2A and 3D, between 2A and 2F are listed on the left separated by “/”. The two comparisons have three common biological processes among the top 10 biological processes.

