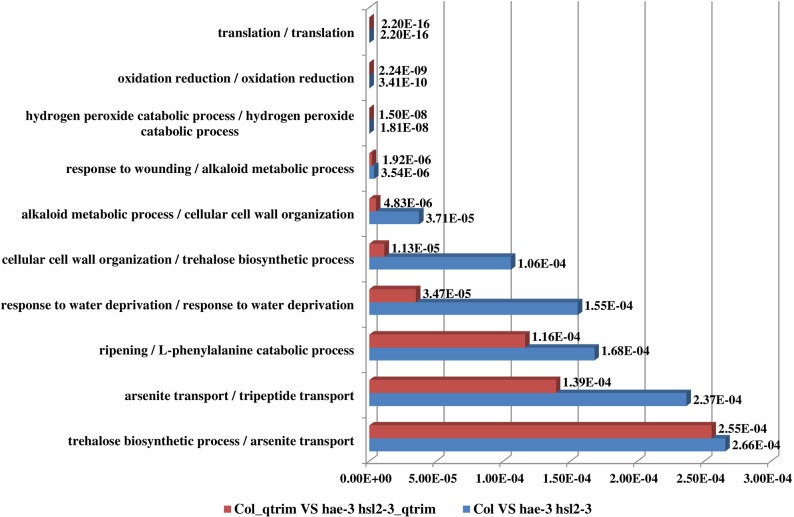
Fig 16. Top 10 biological process functions in the fifth data set.
These functions were predicted for two comparisons between Col and hae-3 hsl2-3, between Col_qtrim and hae-3 hsl2-3_qtrim. Red bars denote the p-values of the top 10 predicted functions for the comparison between Col_qtrim and hae-3 hsl2-3_qtrim and blue bars denote the p-values of the top 10 predicted functions for the comparison between Col and hae-3 hsl2-3. The number besides each bar is the significance of enrichment (p-value) of the predicted function. The p-value was calculated by Fisher’s exact test. The function names of the two comparisons between Col_qtrim and hae-3 hsl2-3_qtrim, between Col and hae-3 hsl2-3 are listed on the left separated by “/”. The two comparisons have 8 common biological processes among the top 10 biological processes.

