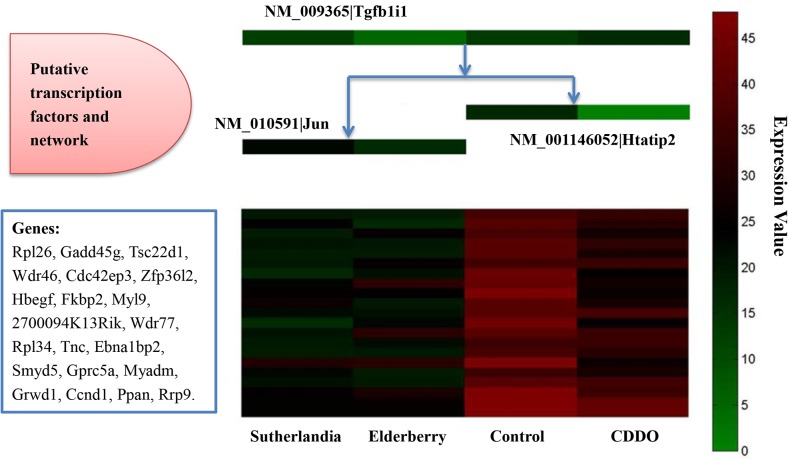
Fig 17. One repression gene regulatory module in mutant mouse cells in the first data set.
The expression correlation score of the module was 0.85. The decision tree on the middle top illustrates how three putative transcription factors (Tgfb1i1, Htatip2, Jun) may collaboratively regulate the cluster of co-expressed genes in the middle bottom, where each row denotes a gene listed in the bottom left box and each column denotes one of four biological conditions (i.e. Control, CDDO, Sutherlandia, and Elderberry). The levels of gene expression values were represented by different colors ranging from lowest (green) to highest (red). The expression of the genes in the cluster under each condition is predicted to be regulated according to the expression levels of transcription factors listed on top of the condition. For example, under Sutherlandia treatment, the relatively low expression of Tgfbli1 and the medium expression of Jun caused the repression of the group of genes.

