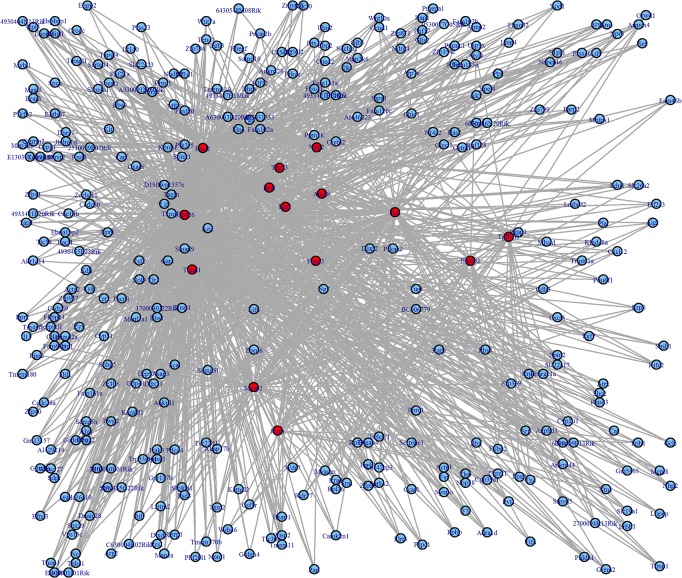
Fig 19. A visualized global gene regulatory network on the first dataset.
The network includes all the gene regulatory relationships between and within top 10 gene regulatory modules ranked by expression correlation scores on the first dataset. Blue nodes represent target genes, and red nodes represent transcription factors which regulate the target genes. Each edge represents a regulatory relationship between a transcription factor and a gene.

