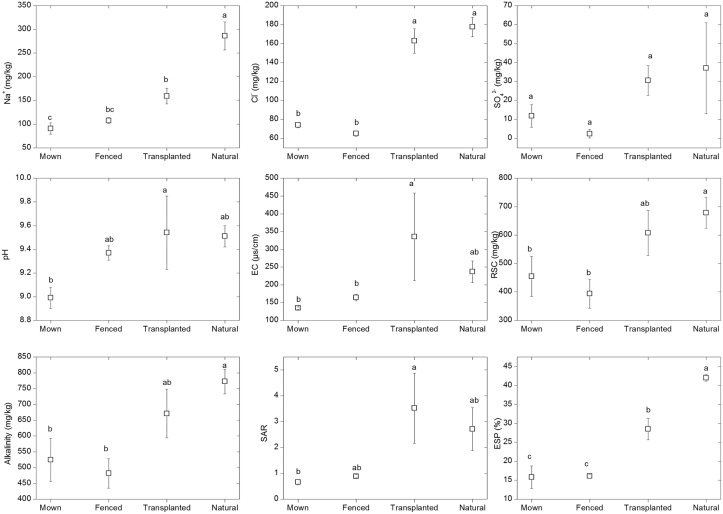
Fig 4. Comparisons of Na+, Cl-, SO4 2-, soil pH, electrical conductivity (EC), residual sodium carbonate (RSC), alkalinity (CO32-+HCO3-), sodium adsorption ratio (SAR) and exchangeable sodium percentage (EXP) among the four different management regimes of Mown, Fenced, Transplanted and Natural (control).
Bars with the same lowercase letters indicate no significant differences (p > 0.05) between different management regimes based on Tukey’s test. Error bars are mean ± s.e. (n = 3).

