
Fig 1. Analysis and comparison of urinary peptide peaks based on fasting plasma glucose of type 2 diabetes mellitus.
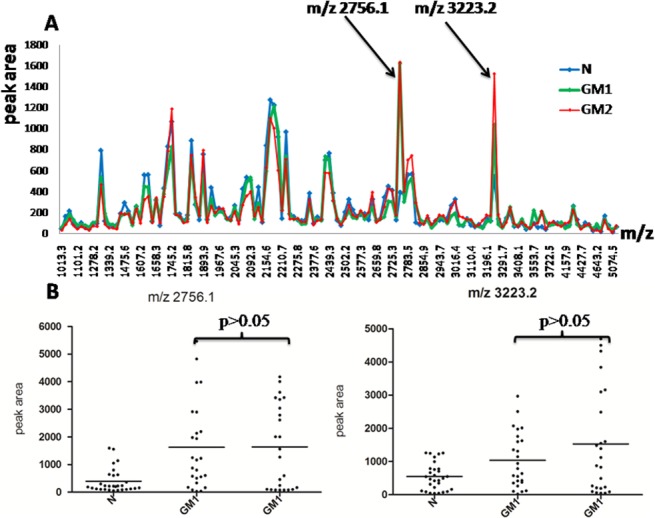
(A) The distribution of the average peak area from the three groups and arrows indicating peaks that had statistically significant difference among three groups (p<0.05). (B) The peak area distributions of m/z 2756.1and m/z 3223.2 in all samples. Throughout comparison between two groups of the three, m/z 2756.1 and m/z 3223.2 had no significant difference (p>0.05) between GM1 and GM2.