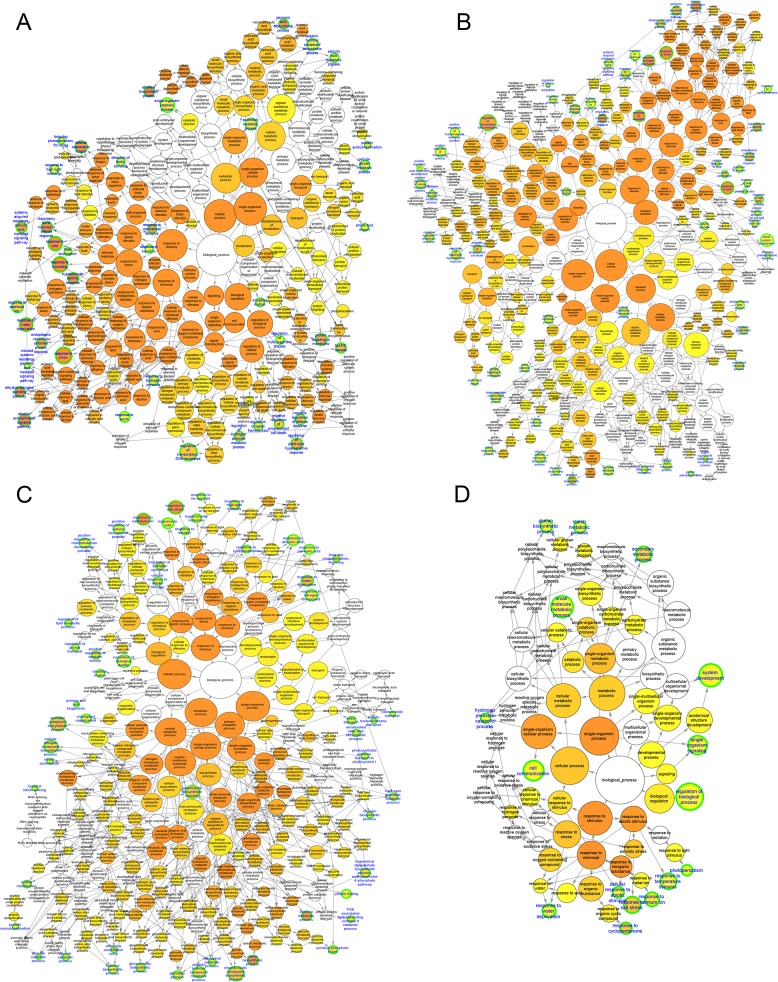
Fig 4. Biological process network of GO term enrichment for differentially expressed (DE) mRNAs.
Over-represented GO terms for DE mRNAs in CT4 (A), CT8 (B), FT4 (C) and FT8 (D) samples, respectively. The node size represents the number of genes associated to a given GO term and node filled color reflects the adjusted P-value. End nodes were indicated by blue label and green border.

