Fig 2.

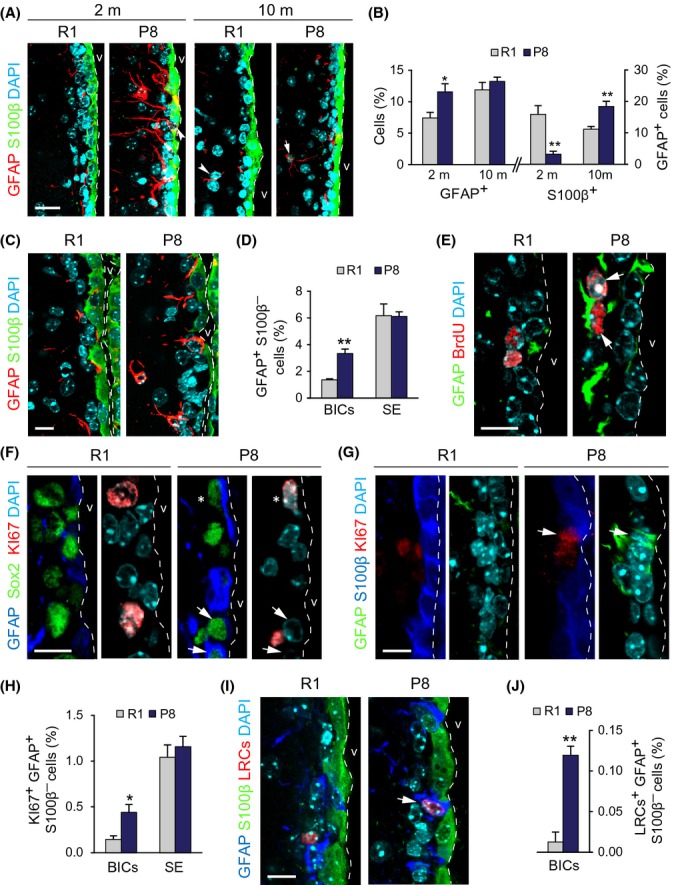
Increased number of proliferating NSCs in the SEZ of young P8 mice. (A) GFAP and S100β detection in the SEZs of 2- and 10-m R1 and P8 mice. (B) Percentage of GFAP+/DAPI cells (left) and of GFAP+S100β+/GFAP+ cells (right) in the SEZs of 2- and 10-m R1 and P8 mice. (C) GFAP and S100β in the SEZ of 2-m R1 and P8 mice. (D) Percentage of GFAP+S100β− BICs and subependymal (SE) cells relative to total cells. (E) GFAP and BrdU in the SEZ of 2-m R1 and P8 mice. (F) GFAP, Sox2, and Ki67 in the SEZ of 2-m R1 and P8 mice. (G) GFAP, S100β, and Ki67 in the SEZ of 2-m R1 and P8 mice. (H) Percentage of Ki67+GFAP+S100β─ BICs and subependymal (SE) cells relative to total cells. (I) GFAP, S100β, and LRCs in the SEZ of 2-m R1 and P8 mice. (J) Percentage of GFAP+S100β─ BrdU+ label retaining BICs. Data are shown as mean ± SEM of 3 independent mice from each strain (*P < 0.05; **P < 0.01). Dashed white line indicates the lateral ventricle (v) limit. White arrowheads point at single-positive cells and white arrows at doubly positive cells. Asterisks indicate triple-positive cells. Scale bars: 10 μm.
