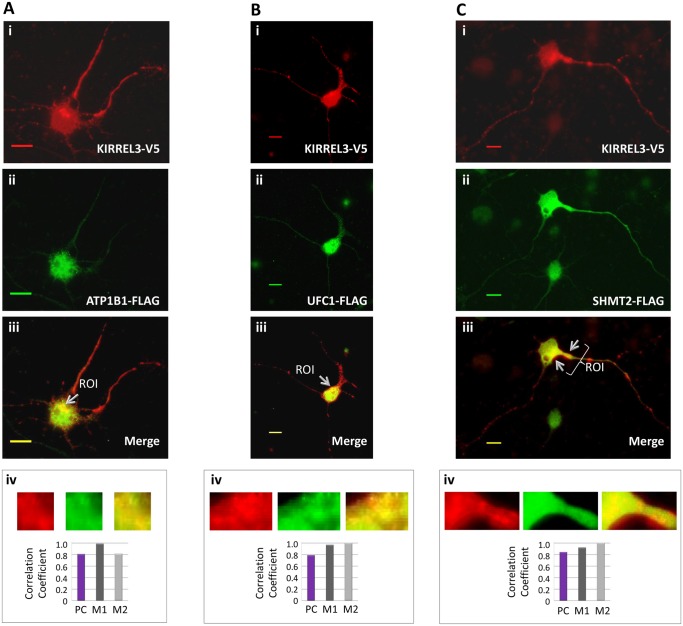
Fig 5. KIRREL3-V5 (red) and ATP1B1-FLAG (green) (A), KIRREL3-V5 (red) and UFC1-FLAG (green) (B), and KIRREL3-V5 (red) and SHMT2-FLAG (green) (C) co-overexpressed in rat PNCs.
The overlapping signals of the two proteins appear as yellow/orange within the region of cytoplasm (A-C, iii), and in neurite processes (Ciii). Enlarged overlay images and individual red and green channels for each ROIs are shown (A-C, iv). The degree of colocalization between the red and green signals was statistically analyzed (A-C, iv) and expressed with Pearson’s correlation coefficient (PC) and Mander’s colocalization coefficients (M1 and M2). Bar, 20μm.

