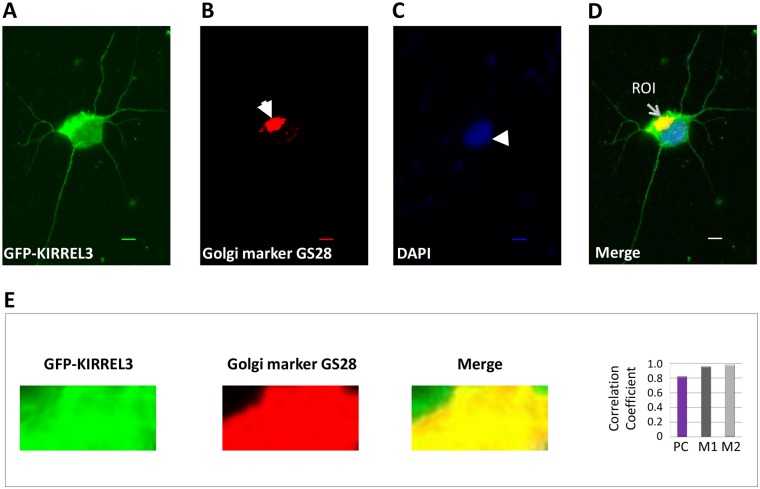
Fig 6. KIRREL3 localizes to the Golgi complex.
Rat PNCs overexpressing the GFP-tagged KIRREL3 were immunostained with GFP antibody (green signal) (A) and the Golgi marker GS28 antibody (red signal, solid arrow) (B). Nuclei were stained with DAPI (blue signal, arrow head) (C). A distinct localized yellow signal (thin arrow) in the merged image (D) suggested the colocalization of KIRREL3 with the Golgi apparatus. Enlarged overlay images and individual red and green channels for a region of interest (ROI) are shown (E). The degree of overlap between the green and red signals was statistically analyzed (E) and expressed with Pearson’s correlation coefficient (PC) and Mander’s colocalization coefficients (M1 and M2). Bar, 20μm.

