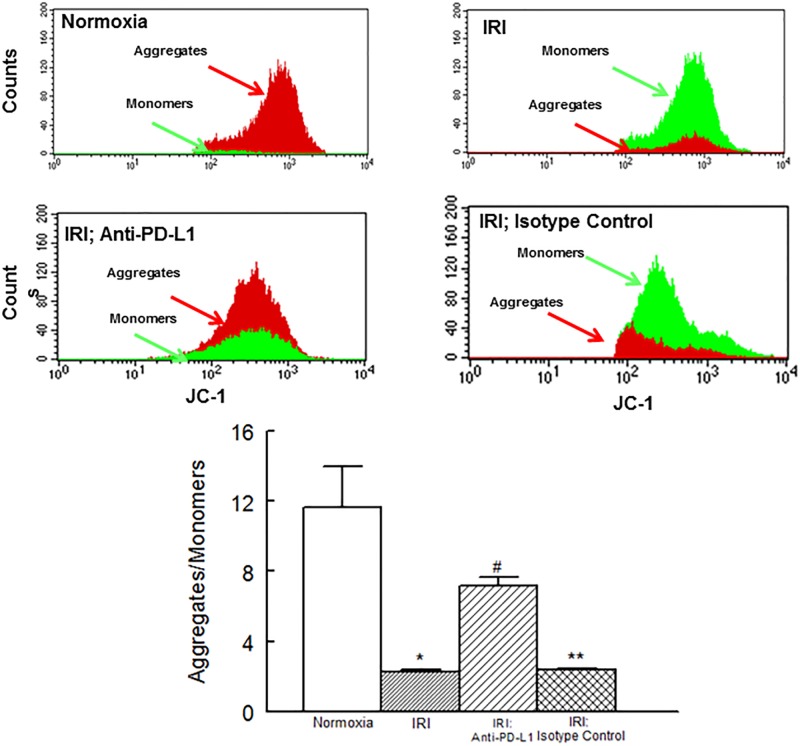
Fig 5.
Panels show representative histograms for JC-1 monomers and JC-1 aggregates in cardiac cell preparations while bar graphs show the ratio of JC-1 aggregates to monomers for experimental groups. Data are means ± SEM; n = 6 hearts/group for normoxic control, IRI and IRI; Anti-PD-L1 and n = 4 for IRI; isotype matching control. IRI: Ischemia Reperfusion Injury. * p<0.05 compared to the normoxic group. ** p<0.05 compared to normoxia or IRI; Anti-PD-L1 group. # p<0.05 compared to IRI or IRI; isotype control group.

