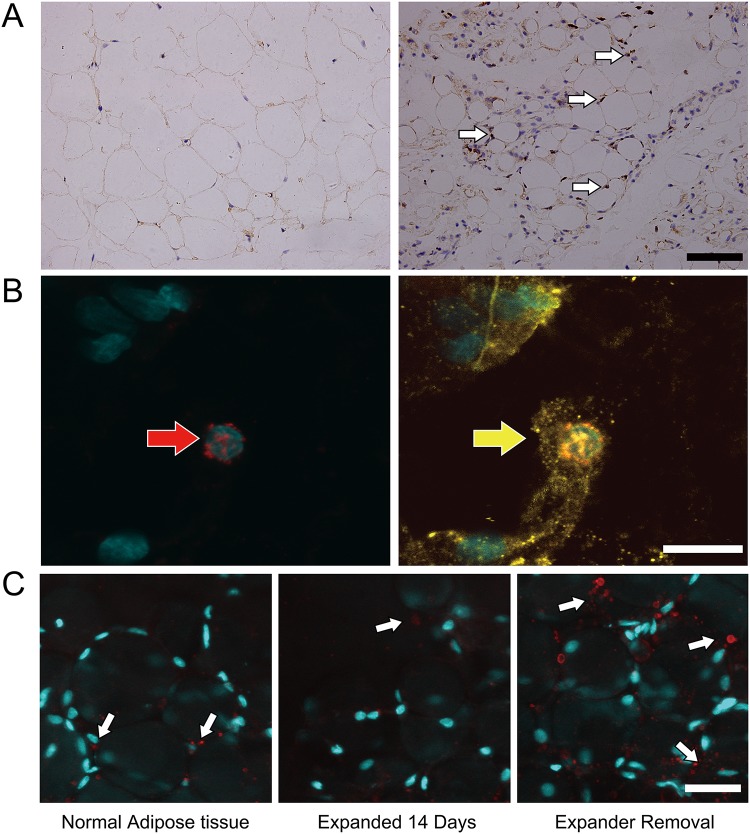
Fig 3. The proliferation and angiogenesis of the fat pad.
A: The number of Ki67+ cells (white arrow) was increased during expension (day 0 left, day 14 right). Scale bar = 50 μm. B: Some of the Ki67+ cells (red arrow) were also perilipin+ (yellow arrow). Scale bar = 10 μm. C: The number of blood vessels (white arrow) did not decrease significantly, and when removing the expander, the angiogenic level increased. Scale bar = 25 μm.

