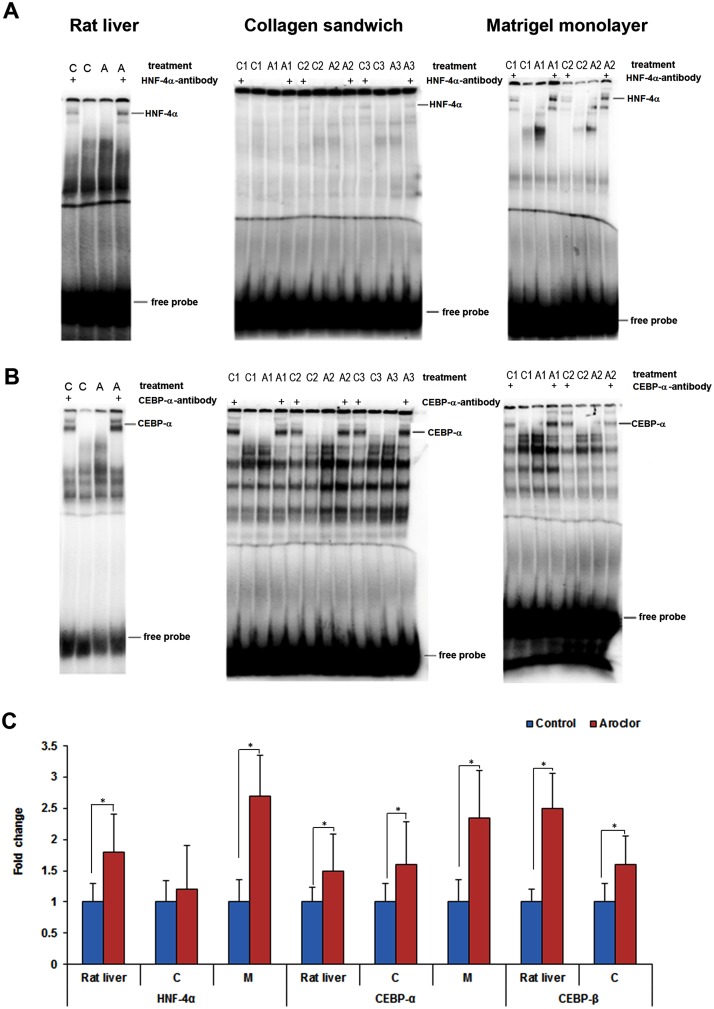
Fig 7. DNA binding activity of HNF-4α, C/EBP-α and C/EBP-β in response to Aroclor 1254 treatment.
Representative EMSA images are depicted in panel (A and B). The results are given as fold changes over controls and are shown in panel (C). Band shift with specific antibodies are indicated by the symbol ‘+’. C: Control, A: Aroclor 1254 treated.

