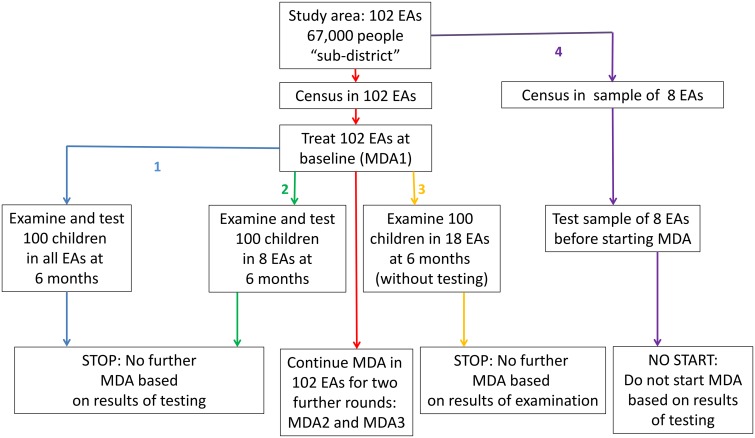
Fig 4. Illustrating alternative strategies involving MDA and testing in the study area (102 EAs 67,156 people) whose costs are compared.
In red is the base strategy of three rounds of MDA in the study area. In blue is strategy 1, testing all EAs after one round of treatment. In green, strategy 2, testing 8 EAs after one round of treatment. In yellow, strategy 3, discontinuing treatment based on examination after one round of treatment. In purple, strategy 4 of not starting MDA at all based on prior testing of 8 EAs.

