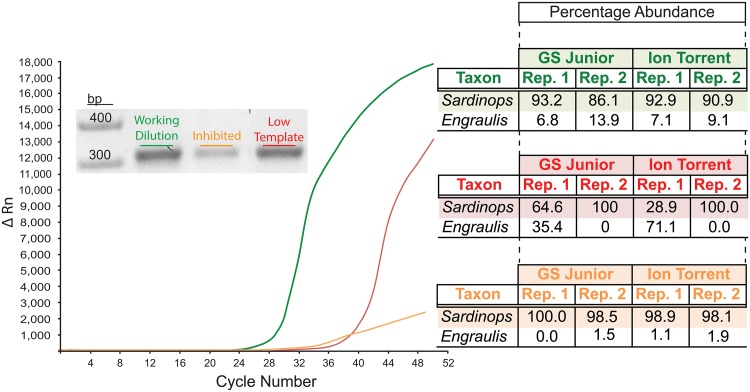
Fig 2. Quantitative PCR and sequencing results of the sample screening assay.
Quantitative PCR curves indicating the presence of DNA and the degree of inhibition (LEFT) with agarose gel electrophoresis clearly indicating the presence of DNA post amplification via means of strong bands (INSET ON GRAPH). Samples were subsequently sequenced and the percentage abundance of two fish genera is indicated, where, based on taxa-specific quantitative PCR results, Sardinops (specifically S. sagax—Australian pilchard) should be in the highest abundance, with Engraulis (specifically E. australis—Australian anchovy) being in the lowest abundance. (RIGHT).

