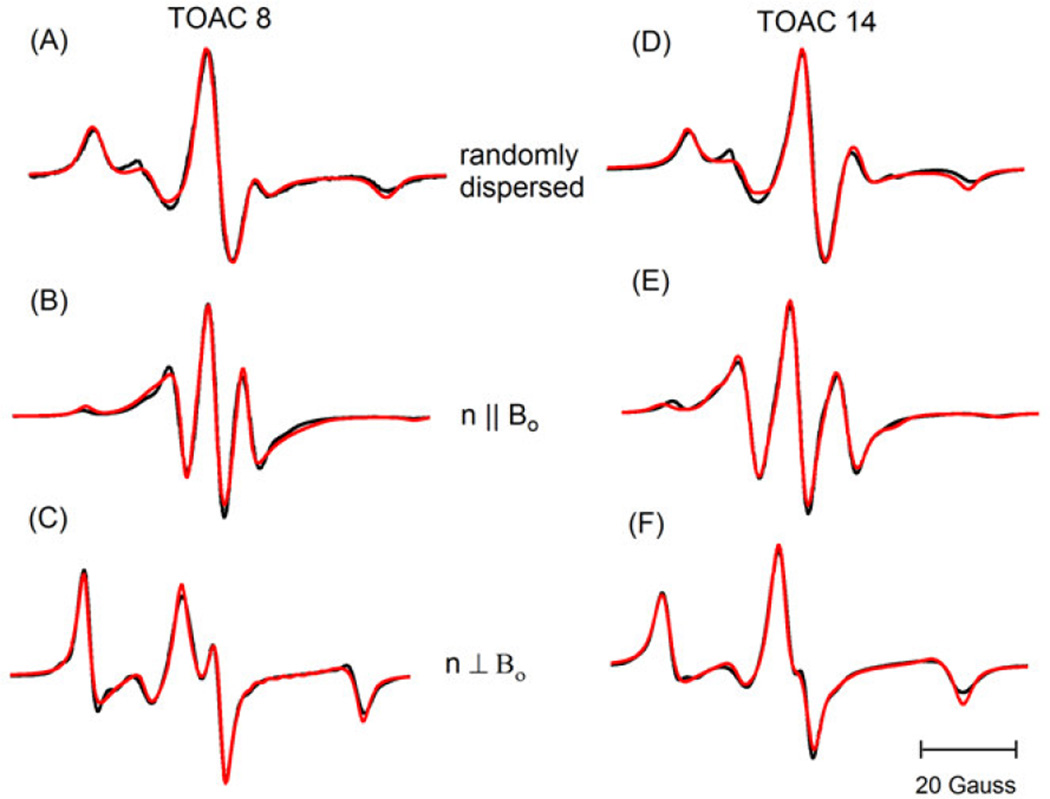
Figure 2.
CW-EPR spectra (black lines) of TOAC8 (left) and TOAC14 (right) magainin- 2 peptides in DMPC bilayers at 318 K together with the best-fit simulations (red lines). The upper panels (A) and (D) contain spectra of randomly dispersed samples. The middle panels (B) and (E) contain spectra from parallel-aligned samples. The lower panels (C) and (F) contain spectra from the perpendicular-aligned samples. For each site, the n||B0 and n⊥Bo were simultaneously analyzed to determine the best fit values of ψ0, σψ, θ, ϕ, components of A and g tensors (Table 2). n represents the membrane normal.

