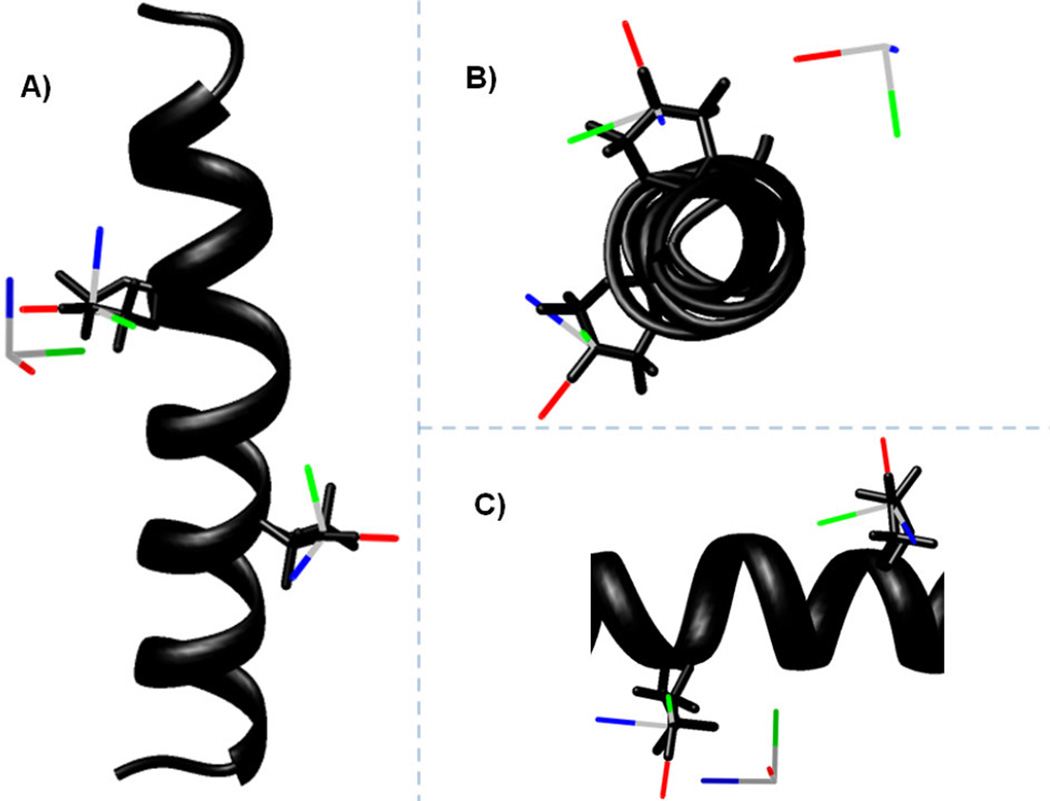
Figure 5.
Three different views comparing the best-fit results to the predicted model of the doubly-labeled peptide. For the predicted model, the helix is shown in black. The nitrogen, oxygen, and adjacent carbon atoms of the TOAC nitroxides are shown as stick models. The TOACs at residues 8 and 14 are colored in black. Overlaid on the TOAC for the model are the calculated x-, y-, and z-axes of the TOAC nitroxides in red, green, and blue respectively. The set of additional axes represent the position and orientation of TOAC8 relative to TOAC14 as back calculated for the best-fit values of the distance and angles determined in Figure 3. Three different views are shown each rotated by 90°.

