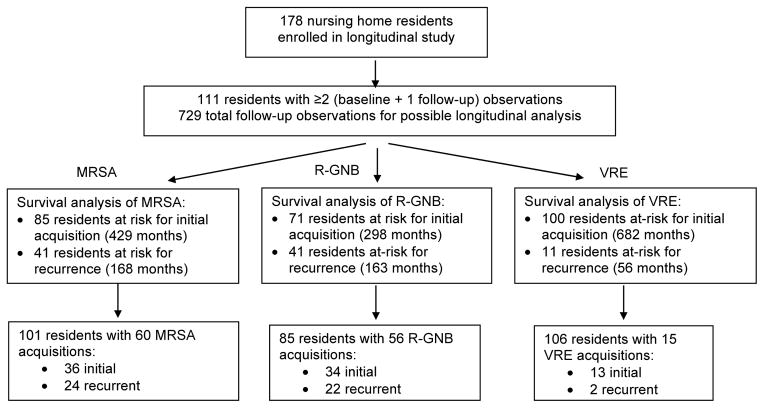
Figure 1. Flow of data from original monthly culture dataset to survival analysis datasets.
This figure describes the flow of data from the 178 NH residents in our original study to our longitudinal analysis on 111 residents. The analytic dataset for the survival analysis is specific to each organism. Residents who are persistently colonized throughout the entire study with that organism cannot be at risk for acquisition of that organism. Once positive for an organism, a resident with continued positivity also stops contributing time at risk. If a resident becomes negative for at least 2 consecutive cultures, he/she can re-enter the study and contribute to time at risk for recurrence.
MRSA= methicillin-resistant Staphylococcus aureus
R-GNB = antibiotic-resistant (ceftazidime or ciprofloxacin) Gram-negative bacteria
VRE = vancomycin-resistant enterococci

