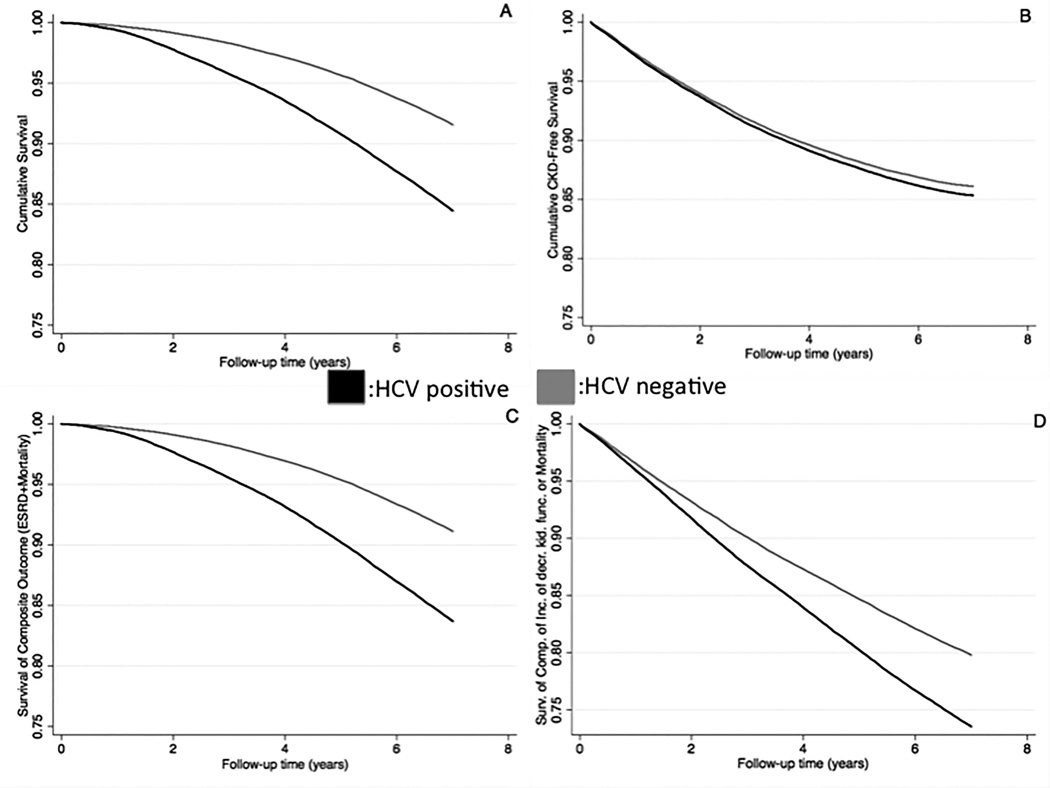
Figure 3.
Kaplan-Meier Survival Curves for various Outcomes (Panel A: All-cause Mortality; Panel B: Incidence of decreased kidney function; Panel C: Composite of ESRD or Mortality; Panel D: Composite of Incidence of decreased kidney function or Mortality) in the Propensity-Matched Cohort (N= 144,178 patients)
Abbreviations: CKD: Chronic kidney disease; ESRD: End stage renal disease

