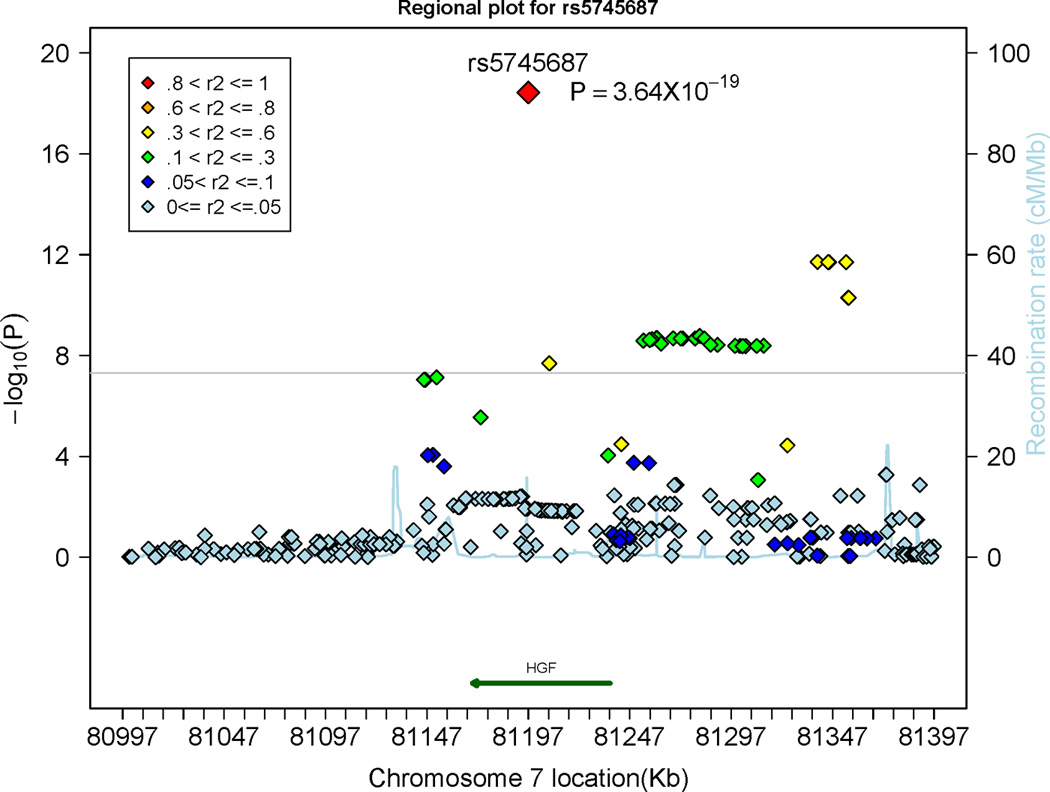
Figure 2.

Regional plot displaying the association of single nucleotide polymorphisms (SNPs) at the hepatocyte growth factor (HGF) gene locus with circulating HGF levels. The colors represent the linkage disequilibrium (expressed as r2) between neighboring SNPs. The grey horizontal line indicates the threshold of genome-wide significance (5 × 10⁻⁸).
