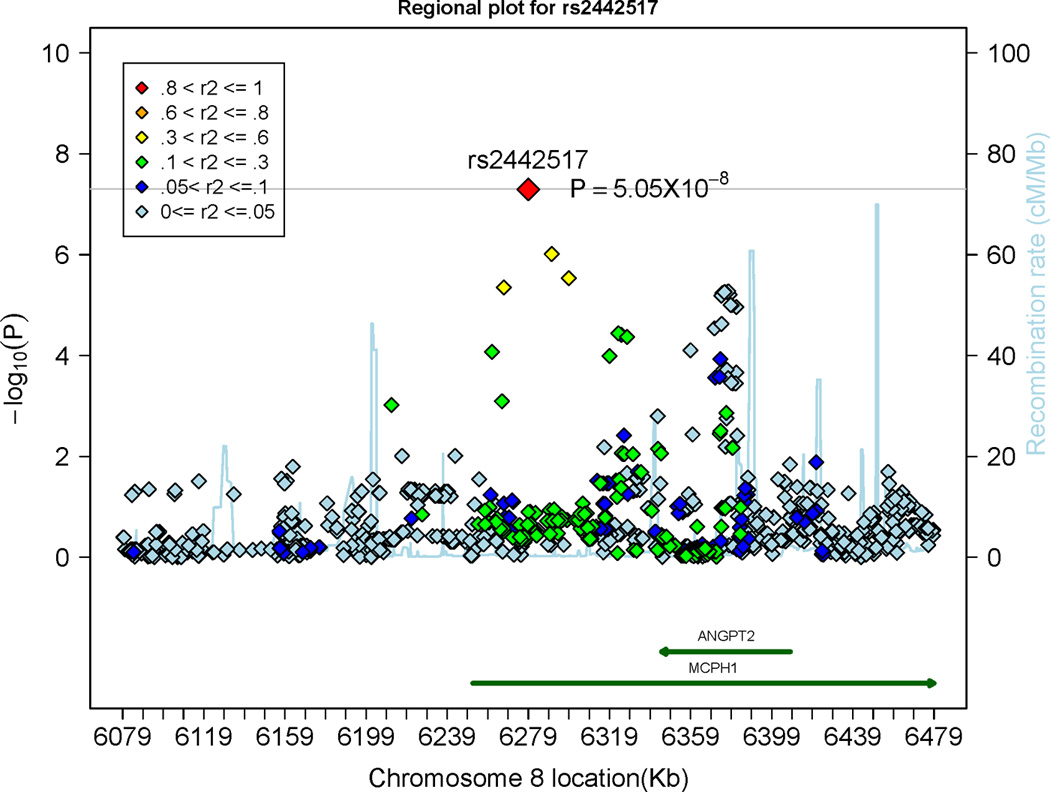
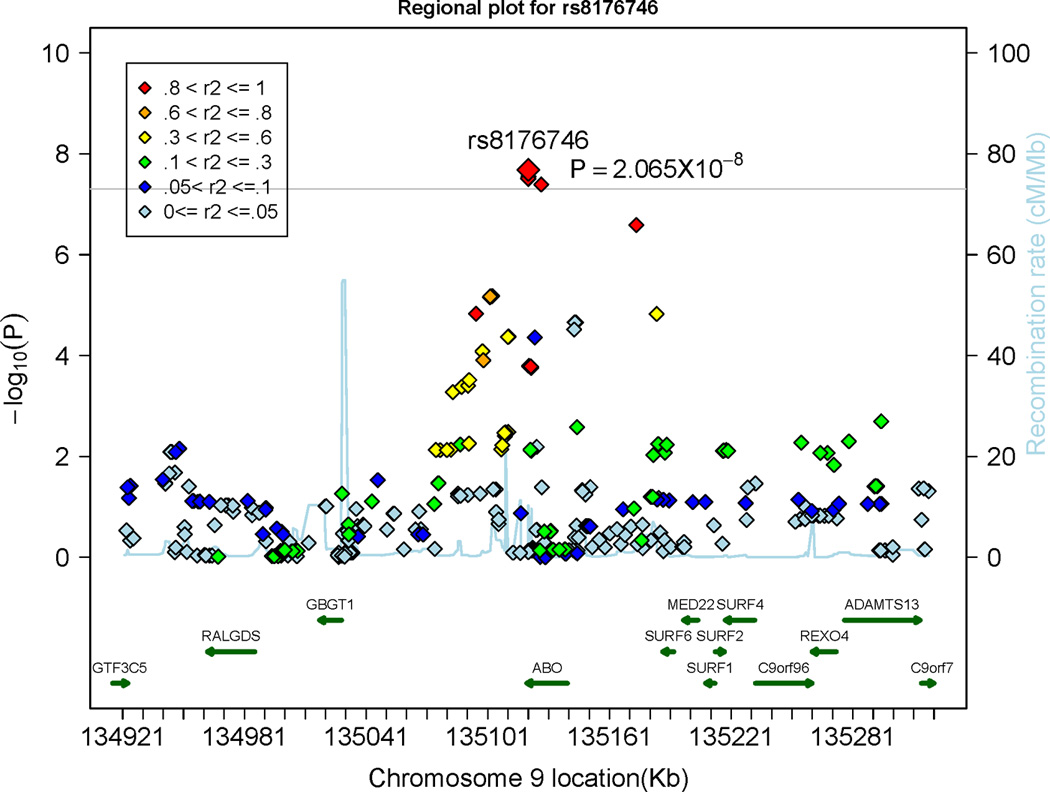
Figure 3.


Regional plots displaying the association of single nucleotide polymorphism (SNPs) at the microcephalin 1 (MCPH1) gene locus (Panel A) and at the ABO locus (Panel B), associated with circulating Angiopoietin-2 levels. The colors represent the linkage disequilibrium (expressed as r2) between neighboring SNPs. ANGPT2 indicates Angiopoietin-2. The grey horizontal line indicates the threshold of genome-wide significance (5 × 10⁻⁸).
