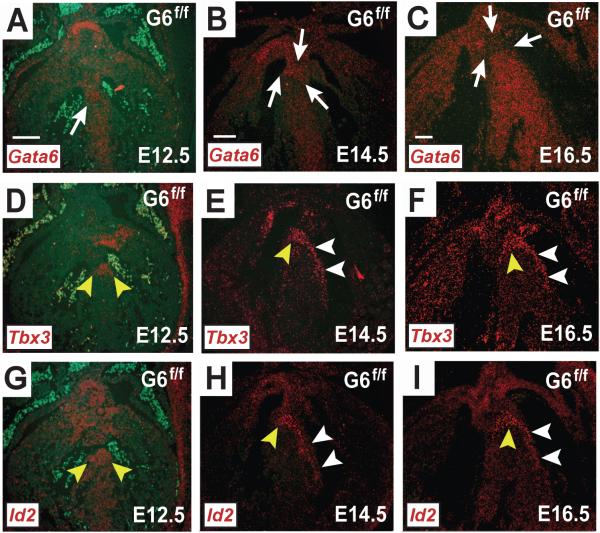
Figure 3.
Gata6 expression in the developing murine AV conduction system. In situ hybridization with probes against Gata6-exon4, Tbx3 and Id2 mRNA in frontal sections from Gata6f/f mouse embryos are shown. At E12.5 with functional Gata6 (A), Gata6 expression overlaps with Tbx3 (D) and Id2 (G). At E14.5 Gata6 transcript expression (B) is weaker in the regions that overlap with Tbx3 (E) and Id2 (H). By E16.5 Gata6 expression (C) is lower in the regions where it overlaps with Tbx3 (F) and Id2 (I), but Gata6 is more robustly expressed in the Tbx3-negative ventricular myocardium. The white arrows point to regions of developing CCS that are either marked or devoid of Gata6+ staining. The yellow arrowheads point to regions of positive signal within the developing AV node and AV bundle. The white arrowheads point to regions of positive signal within the developing bundle branches. Scale bar=100 μm. Scale bar in (A) applies to all E12.5 images; scale bar in (B) applies to all E14.5 images; scale bar in (C) applies to all E16.5 images.

