
Fig 5.
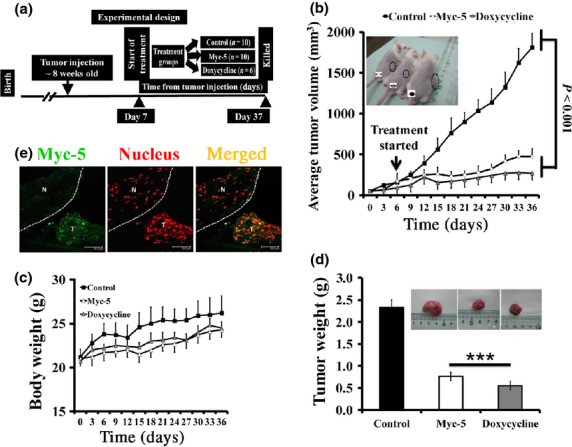
Myc-5 blocks the growth of P493.6 xenografts. (a) Schematic diagram of the xenograft model illustrating timing of tumor implantation and treatment. Eight-week-old SCID mice were s.c. injected with P493.6 cells. (b) Tumor growth chart showing the effect of treatment in vivo. Myc-5 (7.5 mg/kg) and doxycycline significantly slowed tumor growth (P < 0.001) at the termination point in comparison to the control group. Representative picture shows each group of mice (inset). (c) Mean body weight for each treatment group plotted as function of day after post-injection. (e) Comparisons of excised tumor weights for three different treatment groups at the end of study. Data in (b, d, e) are shown as the mean ± SD. Statistical significance was calculated by Student's t-test. ***P < 0.001. (e) FITC-labeled Myc-5 localizes to nucleus of P493.6 xenograft leaving normal tissue unaffected (separated by white line). N: Normal tissue, T: tumor tissue.