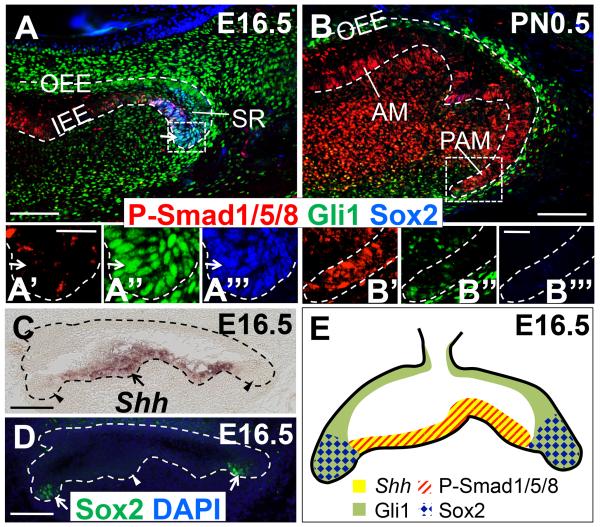
Figure 5. Temporal and spatial relationship of BMP-Smad4, SHH-Gli1 signaling pathway and Sox2+ dental epithelial stem cells during molar development.
(A, B) Immunofluorescence of P-Smad1/5/8 (red), Gli1 (green), and Sox2 (blue) in lower first molars of Gli1-lacZ mice (control) at E16.5 (A) and PN0.5 (B). Detection of Gli1 expression was performed using anti-beta galactosidase antibody. Boxed areas in (A) and (B) are shown magnified in (A’-A’’’) and (B’-B’’’), respectively. Arrows indicate co-expression of Gli1 and Sox2 (light blue). Broken lines indicate dental epithelium. (C, D) In situ hybridization of Shh (C) and immunofluorescence of Sox2 (green) (D) in adjacent sections of E16.5 lower first molars. Arrows indicate expression, whereas arrowheads indicate lack of detectable expression. Broken lines indicate dental epithelium. (E) Schematic diagram of the expression patterns of Shh (yellow), P-Smad1/5/8 (red), Gli1 (green), and Sox2 (blue) in the dental epithelium (indicated by black line) of lower first molars at E16.5. AM: Ameloblast; IEE: Inner enamel epithelium; OEE: Outer enamel epithelium; PAM: Preameloblast; SR: Stellate reticulum. Scale bars (A-D): 100μm. Scale bars (A’-A’’’, B’-B’’’): 25μm.

